1
original.pdf layout_review.html excluded_blocks.html final_body_blocks.tsv layout_blocks.tsv
绿色编号 = 最终进入正文的段落顺序;蓝色虚线 = section heading 边界。每个条目同时显示 Docling 页内原序、新页内顺序和识别栏位;排序只在同页内调整,不拆分文本块。
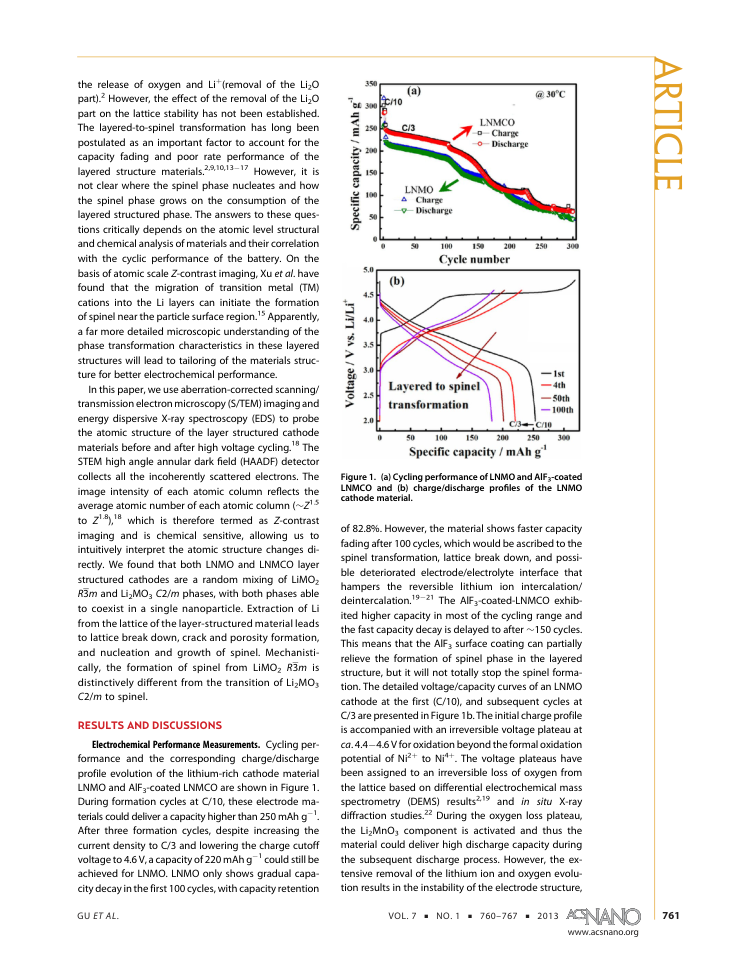

| # | page | Docling 页内原序 | 新页内顺序 | global layout order | zone | column | region | bbox | text |
|---|---|---|---|---|---|---|---|---|---|
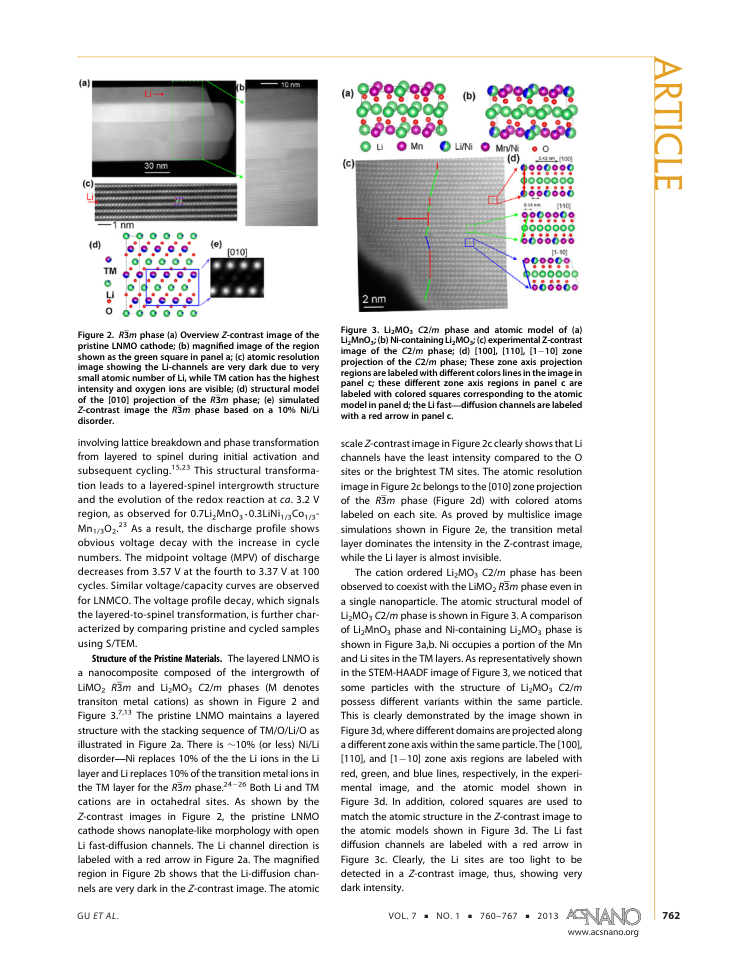
| 1 | 1 | 4 | 4 | 3 | page_body | column_1_of_2 | p1:body_region:0 | [51.82, 202.65, 430.22, 47.68] | † Environmental Molecular Science Laboratory, ^ Fundamental and Computational Science Directorate, and # Energy and Environmental Directorate, Paci fi c Northwest National Laboratory, 902 Battelle Boulevard, Richland, Washington 99352, United States, ‡ Chemical Sciences and Engineering Division, Argonne National Laboratory, 9700 South Cass Avenue, Argonne, Illinois 60439, United States, and § FEI Company, 5350 NE Dawson Creek Drive, Hillsboro, Oregon 97124, United States |
| 2 | 2 | 5 | 4 | 21 | bottom_margin | column_1_of_2 | p2:body_region:0 | [64.74, 617.25, 201.28, 127.49] | Electrochemical Performance Measurements. Cycling performance and the corresponding charge/discharge profile evolution of the lithium-rich cathode material LNMO and AlF3-coated LNMCO are shown in Figure 1. During formation cycles at C/10, these electrode materials could deliver a capacity higher than 250 mAh g 1 . After three formation cycles, despite increasing the current density to C/3 and lowering the charge cutoff voltage to 4.6 V, a capacity of 220 mAh g 1 could still be achieved for LNMO. LNMO only shows gradual capacity decay in the first 100 cycles, with capacity retention |
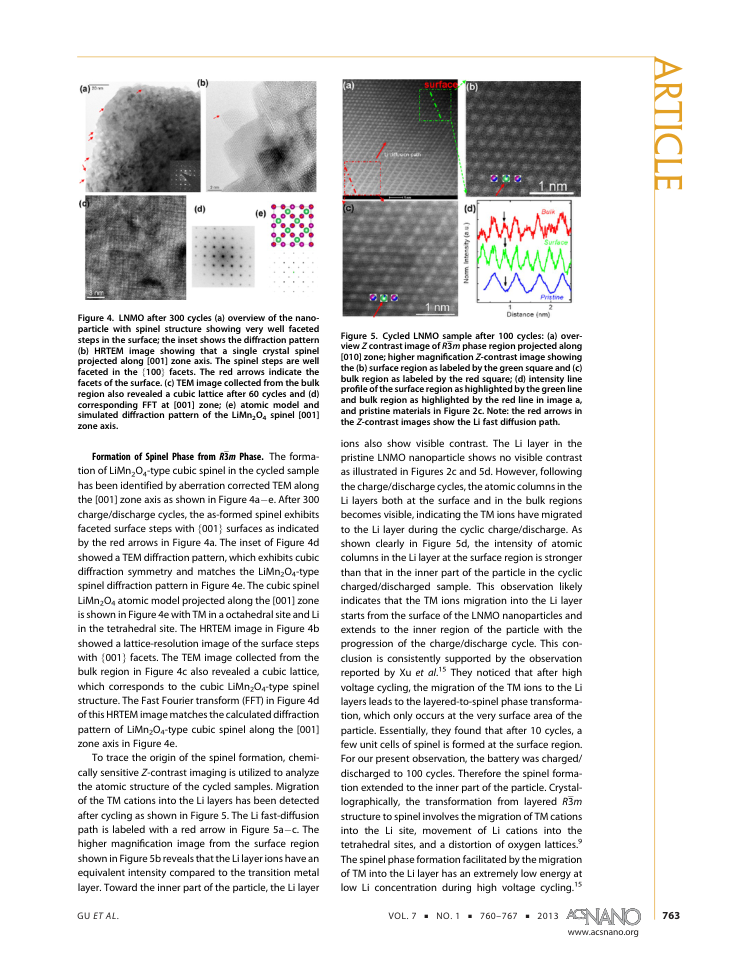
| 3 | 2 | 6 | 8 | 25 | bottom_margin | column_2_of_2 | p2:body_region:1 | [283.92, 437.69, 201.28, 306.71] | of 82.8%. However, the material shows faster capacity fading after 100 cycles, which would be ascribed to the spinel transformation, lattice break down, and possible deteriorated electrode/electrolyte interface that hampers the reversible lithium ion intercalation/ deintercalation. 19 21 The AlF3-coated-LNMCO exhibited higher capacity in most of the cycling range and the fast capacity decay is delayed to after ∼ 150 cycles. This means that the AlF3 surface coating can partially relieve the formation of spinel phase in the layered structure, but it will not totally stop the spinel formation. The detailed voltage/capacity curves of an LNMO cathode at the first (C/10), and subsequent cycles at C/3 are presented in Figure 1b. The initial charge profile is accompanied with an irreversible voltage plateau at ca . 4.4 4.6 V for oxidation beyond the formal oxidation potential of Ni 2 þ to Ni 4 þ . The voltage plateaus have been assigned to an irreversible loss of oxygen from the lattice based on differential electrochemical mass spectrometry (DEMS) results 2,19 and in situ X-ray diffraction studies. 22 During the oxygen loss plateau, the Li2MnO3 component is activated and thus the material could deliver high discharge capacity during the subsequent discharge process. However, the extensive removal of the lithium ion and oxygen evolution results in the instability of the electrode structure, |
| 4 | 3 | 1 | 2 | 30 | page_body | column_1_of_2 | p3:body_region:0 | [64.74, 365.41, 201.31, 175.18] | involving lattice breakdown and phase transformation from layered to spinel during initial activation and subsequent cycling. 15,23 This structural transformation leads to a layered-spinel intergrowth structure and the evolution of the redox reaction at ca . 3.2 V region, as observed for 0.7Li2MnO3 3 0.3LiNi1/3Co1/3Mn1/3O2. 23 As a result, the discharge profile shows obvious voltage decay with the increase in cycle numbers. The midpoint voltage (MPV) of discharge decreases from 3.57 V at the fourth to 3.37 V at 100 cycles. Similar voltage/capacity curves are observed for LNMCO. The voltage profile decay, which signals the layered-to-spinel transformation, is further characterized by comparing pristine and cycled samples using S/TEM. |
| 5 | 3 | 4 | 3 | 31 | bottom_margin | column_1_of_2 | p3:body_region:0 | [64.74, 545.53, 201.27, 199.27] | Structure of the Pristine Materials. The layered LNMO is a nanocomposite composed of the intergrowth of LiMO2 R 3 m and Li2MO3 C 2/ m phases (M denotes transiton metal cations) as shown in Figure 2 and Figure 3. 7,13 The pristine LNMO maintains a layered structure with the stacking sequence of TM/O/Li/O as illustrated in Figure 2a. There is ∼ 10% (or less) Ni/Li disorder ; Ni replaces 10% of the the Li ions in the Li layer and Li replaces 10% of the transition metal ions in the TM layer for the R 3 m phase. 24 26 Both Li and TM cations are in octahedral sites. As shown by the Z -contrast images in Figure 2, the pristine LNMO cathode shows nanoplate-like morphology with open Li fast-diffusion channels. The Li channel direction is labeled with a red arrow in Figure 2a. The magnified region in Figure 2b shows that the Li-diffusion channels are very dark in the Z -contrast image. The atomic |
| 6 | 3 | 5 | 7 | 35 | page_body | column_2_of_2 | p3:body_region:1 | [283.92, 366.2, 201.28, 103.47] | scale Z -contrast image in Figure 2c clearly shows that Li channels have the least intensity compared to the O sites or the brightest TM sites. The atomic resolution imagein Figure 2c belongs to the [010] zone projection of the R 3 m phase (Figure 2d) with colored atoms labeled on each site. As proved by multislice image simulations shown in Figure 2e, the transition metal layer dominates the intensity in the Z-contrast image, while the Li layer is almost invisible. |
| 7 | 3 | 7 | 8 | 36 | bottom_margin | column_2_of_2 | p3:body_region:1 | [283.92, 473.8, 201.28, 270.87] | The cation ordered Li2MO3 C 2/ m phase has been observed to coexist with the LiMO2 R 3 m phase even in a single nanoparticle. The atomic structural model of Li2MO3 C 2/ m phase is shown in Figure 3. A comparison of Li2MnO3 phase and Ni-containing Li2MO3 phase is shown in Figure 3a,b. Ni occupies a portion of the Mn and Li sites in the TM layers. As representatively shown in the STEM-HAADF image of Figure 3, we noticed that some particles with the structure of Li2MO3 C 2/ m possess di ff erent variants within the same particle. This is clearly demonstrated by the image shown in Figure 3d, where di ff erent domains are projected along a di ff erent zone axis within the same particle. The [100], [110], and [1 10] zone axis regions are labeled with red, green, and blue lines, respectively, in the experimental image, and the atomic model shown in Figure 3d. In addition, colored squares are used to match the atomic structure in the Z -contrast image to the atomic models shown in Figure 3d. The Li fast di ff usion channels are labeled with a red arrow in Figure 3c. Clearly, the Li sites are too light to be detected in a Z -contrast image, thus, showing very dark intensity. |
| 8 | 4 | 6 | 2 | 41 | page_body | column_1_of_2 | p4:body_region:0 | [64.74, 375.76, 201.27, 248.57] | Formation of Spinel Phase from R 3 m Phase. The formation of LiMn2O4-type cubic spinel in the cycled sample has been identified by aberration corrected TEM along the [001] zone axis as shown in Figure 4a e. After 300 charge/discharge cycles, the as-formed spinel exhibits faceted surface steps with { 001 } surfaces as indicated by the red arrows in Figure 4a. The inset of Figure 4d showed a TEM diffraction pattern, which exhibits cubic diffraction symmetry and matches the LiMn2O4-type spinel diffraction pattern in Figure 4e. The cubic spinel LiMn2O4 atomic model projected along the [001] zone is shown in Figure 4e with TM in a octahedral site and Li in the tetrahedral site. The HRTEM image in Figure 4b showed a lattice-resolution image of the surface steps with { 001 } facets. The TEM image collected from the bulk region in Figure 4c also revealed a cubic lattice, which corresponds to the cubic LiMn2O4-type spinel structure. The Fast Fourier transform (FFT) in Figure 4d of this HRTEM image matches the calculated diffraction pattern of LiMn2O4-type cubic spinel along the [001] zone axis in Figure 4e. |
| 9 | 4 | 7 | 3 | 42 | bottom_margin | column_1_of_2 | p4:body_region:0 | [64.74, 628.46, 201.26, 115.42] | To trace the origin of the spinel formation, chemically sensitive Z -contrast imaging is utilized to analyze the atomic structure of the cycled samples. Migration of the TM cations into the Li layers has been detected after cycling as shown in Figure 5. The Li fast-di ff usion path is labeled with a red arrow in Figure 5a c. The higher magni fi cation image from the surface region showninFigure 5b reveals that the Li layer ions have an equivalent intensity compared to the transition metal layer. Toward the inner part of the particle, the Li layer |
| 10 | 4 | 3 | 7 | 46 | bottom_margin | column_2_of_2 | p4:body_region:1 | [283.92, 366.14, 201.27, 378.43] | ions also show visible contrast. The Li layer in the pristine LNMO nanoparticle shows no visible contrast as illustrated in Figures 2c and 5d. However, following the charge/discharge cycles, the atomic columns in the Li layers both at the surface and in the bulk regions becomes visible, indicating the TM ions have migrated to the Li layer during the cyclic charge/discharge. As shown clearly in Figure 5d, the intensity of atomic columns in the Li layer at the surface region is stronger than that in the inner part of the particle in the cyclic charged/discharged sample. This observation likely indicates that the TM ions migration into the Li layer starts from the surface of the LNMO nanoparticles and extends to the inner region of the particle with the progression of the charge/discharge cycle. This conclusion is consistently supported by the observation reported by Xu et al . 15 They noticed that after high voltage cycling, the migration of the TM ions to the Li layers leads to the layered-to-spinel phase transformation, which only occurs at the very surface area of the particle. Essentially, they found that after 10 cycles, a few unit cells of spinel is formed at the surface region. For our present observation, the battery was charged/ discharged to 100 cycles. Therefore the spinel formation extended to the inner part of the particle. Crystallographically, the transformation from layered R 3 m structure to spinel involves the migration of TM cations into the Li site, movement of Li cations into the tetrahedral sites, and a distortion of oxygen lattices. 9 The spinel phase formation facilitated by the migration of TM into the Li layer has an extremely low energy at low Li concentration during high voltage cycling. 15 |
| 11 | 5 | 1 | 2 | 52 | page_body | column_1_of_2 | p5:body_region:0 | [64.74, 365.01, 201.29, 115.42] | Associated with these structural transformation characteristics, the spinels formed within a parental layered particle show features of a mosaic structure as seen in Figure 4. Formation of spinel destroyed the layered characteristics of the R 3 m phase, which resulted in poor rate performance due to the block of the Li fast di ff usion channel. This phase transformation is one of the primary factors contributing to the capacity fading and poor rate performance of these cathode materials. 15 |
| 12 | 5 | 4 | 3 | 53 | page_body | column_1_of_2 | p5:body_region:0 | [64.74, 484.58, 201.27, 163.22] | Ni concentration appears to play a role on the layered structure to spinel transformation. 27 Gu et al . used STEM and EDS mapping to analyze the composition and phase distribution in pristine LNMO. 7 The Li2MO3 phase contains Ni in most regions ( ∼ 20% Ni/ (Ni þ Mn)) atomic ratio). 7 Hence, LNMO cannot be simply written as 0.5LiNi0.5Mn0.5O2 3 0.5Li2MnO3. The average Ni/(Ni þ Mn) ratio in the LiMO2 phase should be less than 50% as in LiNi0.5Mn0.5O2. The decreased Ni content may be one of the reasons that the LiMO2 R 3 m phase transformed to spinel after cycling. 27 A very similar phase transformation process has also been identi fi ed in the LNMCO cathode after high voltage cycling. |
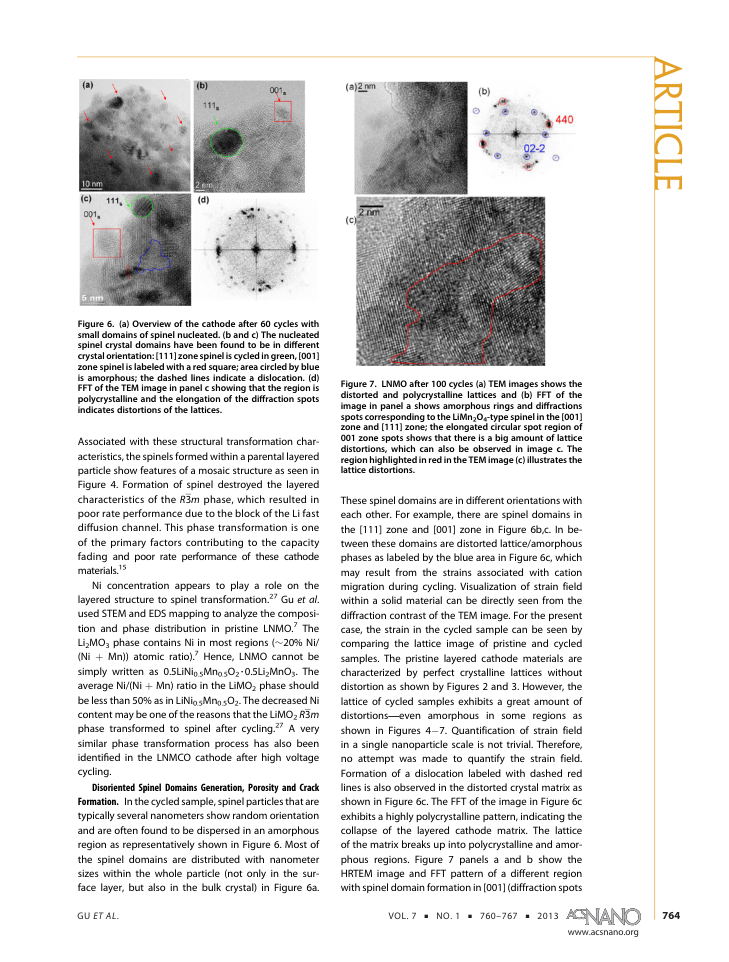
| 13 | 5 | 5 | 4 | 54 | bottom_margin | column_1_of_2 | p5:body_region:0 | [64.74, 652.79, 201.25, 91.66] | Disoriented Spinel Domains Generation, Porosity and Crack Formation. In the cycled sample, spinel particles that are typically several nanometers show random orientation and are often found to be dispersed in an amorphous region as representatively shown in Figure 6. Most of the spinel domains are distributed with nanometer sizes within the whole particle (not only in the surface layer, but also in the bulk crystal) in Figure 6a. |
| 14 | 5 | 7 | 8 | 58 | bottom_margin | column_2_of_2 | p5:body_region:1 | [283.92, 413.93, 201.27, 330.63] | These spinel domains are in different orientations with each other. For example, there are spinel domains in the [111] zone and [001] zone in Figure 6b,c. In between these domains are distorted lattice/amorphous phases as labeled by the blue area in Figure 6c, which may result from the strains associated with cation migration during cycling. Visualization of strain field within a solid material can be directly seen from the diffraction contrast of the TEM image. For the present case, the strain in the cycled sample can be seen by comparing the lattice image of pristine and cycled samples. The pristine layered cathode materials are characterized by perfect crystalline lattices without distortion as shown by Figures 2 and 3. However, the lattice of cycled samples exhibits a great amount of distortions ; even amorphous in some regions as shown in Figures 4 7. Quantification of strain field in a single nanoparticle scale is not trivial. Therefore, no attempt was made to quantify the strain field. Formation of a dislocation labeled with dashed red lines is also observed in the distorted crystal matrix as shown in Figure 6c. The FFT of the image in Figure 6c exhibits a highly polycrystalline pattern, indicating the collapse of the layered cathode matrix. The lattice of the matrix breaks up into polycrystalline and amorphous regions. Figure 7 panels a and b show the HRTEM image and FFT pattern of a different region with spinel domain formation in [001] (diffraction spots |
| 15 | 6 | 1 | 1 | 62 | page_body | column_1_of_2 | [64.74, 67.15, 201.25, 91.56] | circled in red) and [111] (diffraction spots circled in blue) zone axis. The amorphous ring patterns indicate that amorphous regions must exist in this region in the TEM image in Figure 7a. A higher magnification TEM image is shown in Figure 7c, where the lattice shows a high degree of distortion in the phase boundaries of crystals with different orientations as labeled in red. In the meantime, porosity formation has been detected | |
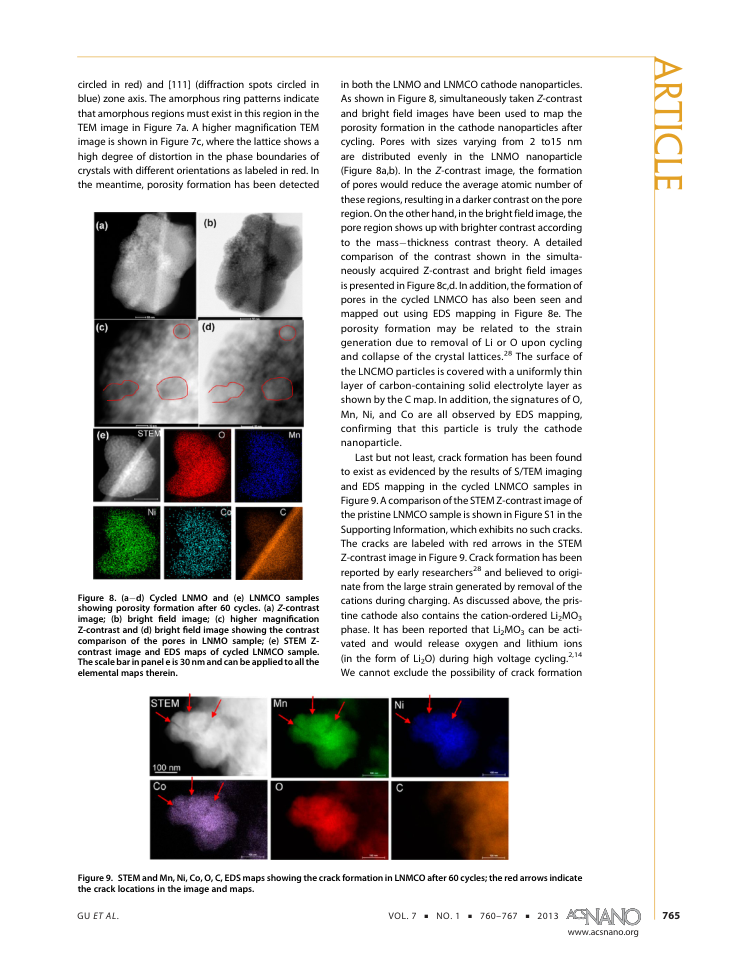
| 16 | 6 | 2 | 6 | 67 | page_body | column_2_of_2 | p6:body_region:0 | [283.92, 67.14, 201.31, 306.71] | in both the LNMO and LNMCO cathode nanoparticles. As shown in Figure 8, simultaneously taken Z -contrast and bright field images have been used to map the porosity formation in the cathode nanoparticles after cycling. Pores with sizes varying from 2 to15 nm are distributed evenly in the LNMO nanoparticle (Figure 8a,b). In the Z -contrast image, the formation of pores would reduce the average atomic number of these regions, resulting in a darker contrast on the pore region. On the other hand, in the bright field image, the pore region shows up with brighter contrast according to the mass thickness contrast theory. A detailed comparison of the contrast shown in the simultaneously acquired Z-contrast and bright field images is presented in Figure 8c,d. In addition, the formation of pores in the cycled LNMCO has also been seen and mapped out using EDS mapping in Figure 8e. The porosity formation may be related to the strain generation due to removal of Li or O upon cycling and collapse of the crystal lattices. 28 The surface of the LNCMO particles is covered with a uniformly thin layer of carbon-containing solid electrolyte layer as shown by the C map. In addition, the signatures of O, Mn, Ni, and Co are all observed by EDS mapping, confirming that this particle is truly the cathode nanoparticle. |
| 17 | 6 | 5 | 7 | 68 | page_body | column_2_of_2 | p6:body_region:0 | [283.92, 377.99, 201.28, 187.14] | Last but not least, crack formation has been found to exist as evidenced by the results of S/TEM imaging and EDS mapping in the cycled LNMCO samples in Figure 9. A comparison of the STEM Z-contrast image of the pristine LNMCO sample is shown in Figure S1 in the Supporting Information, which exhibits no such cracks. The cracks are labeled with red arrows in the STEM Z-contrast image in Figure 9. Crack formation has been reported by early researchers 28 and believed to originate from the large strain generated by removal of the cations during charging. As discussed above, the pristine cathode also contains the cation-ordered Li2MO3 phase. It has been reported that Li2MO3 can be activated and would release oxygen and lithium ions (in the form of Li2O) during high voltage cycling. 2,14 We cannot exclude the possibility of crack formation |
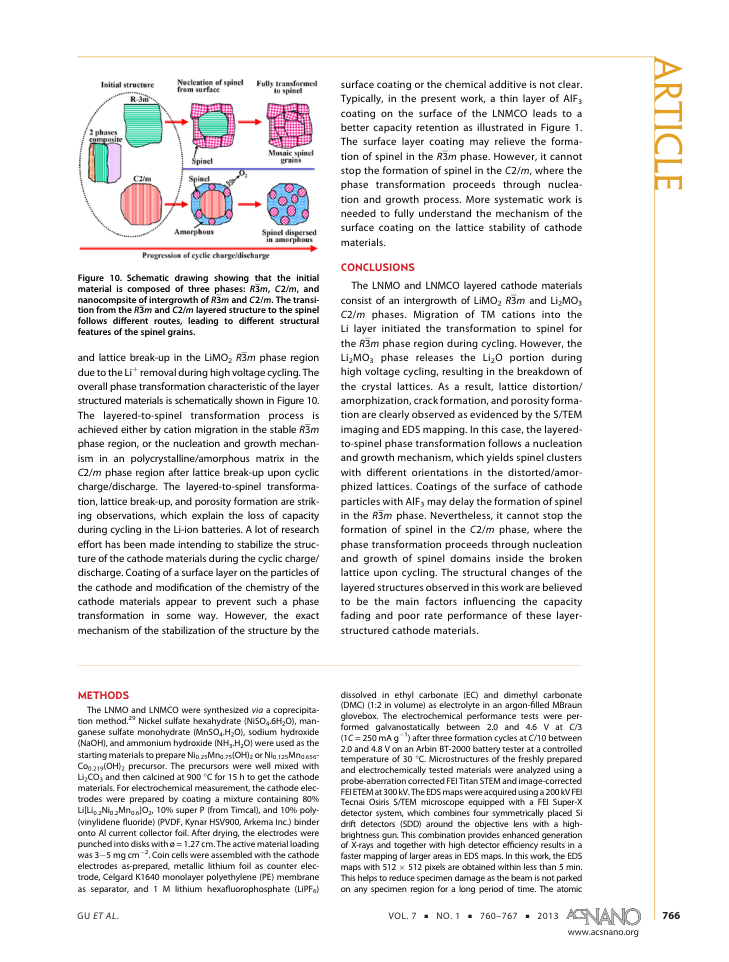
| 18 | 7 | 1 | 2 | 73 | body_zone | column_1_of_2 | p7:body_region:0 | [64.74, 294.94, 201.28, 234.99] | and lattice break-up in the LiMO2 R 3 m phase region duetotheLi þ removal during high voltage cycling. The overall phase transformation characteristic of the layer structured materials is schematically shown in Figure 10. The layered-to-spinel transformation process is achieved either by cation migration in the stable R 3 m phase region, or the nucleation and growth mechanism in an polycrystalline/amorphous matrix in the C 2/ m phase region after lattice break-up upon cyclic charge/discharge. The layered-to-spinel transformation, lattice break-up, and porosity formation are striking observations, which explain the loss of capacity during cycling in the Li-ion batteries. A lot of research e ff ort has been made intending to stabilize the structure of the cathode materials during the cyclic charge/ discharge. Coating of a surface layer on the particles of the cathode and modi fi cation of the chemistry of the cathode materials appear to prevent such a phase transformation in some way. However, the exact mechanism of the stabilization of the structure by the |
| 19 | 7 | 5 | 4 | 75 | bottom_margin | column_1_of_2 | p7:body_region:0 | [64.74, 589.16, 201.27, 155.38] | The LNMO and LNMCO were synthesized via a coprecipitation method. 29 Nickel sulfate hexahydrate (NiSO4.6H2O), manganese sulfate monohydrate (MnSO4.H2O), sodium hydroxide (NaOH), and ammonium hydroxide (NH3.H2O) were used as the starting materials to prepare Ni0.25Mn0.75(OH)2 or Ni0.125Mn0.656Co0.219(OH)2 precursor. The precursors were well mixed with Li2CO3 and then calcined at 900 ° C for 15 h to get the cathode materials. For electrochemical measurement, the cathode electrodes were prepared by coating a mixture containing 80% Li[Li0.2Ni0.2Mn0.6]O2, 10% super P (from Timcal), and 10% poly(vinylidene fl uoride) (PVDF, Kynar HSV900, Arkema Inc.) binder onto Al current collector foil. After drying, the electrodes were punched into disks with ø = 1.27 cm. The active material loading was 3 5 mg cm 2 . Coin cells were assembled with the cathode electrodes as-prepared, metallic lithium foil as counter electrode, Celgard K1640 monolayer polyethylene (PE) membrane as separator, and 1 M lithium hexa fl uorophosphate (LiPF6) |
| 20 | 7 | 6 | 7 | 78 | front_matter | column_2_of_2 | p7:body_region:1 | [283.92, 67.14, 201.3, 139.35] | surface coating or the chemical additive is not clear. Typically, in the present work, a thin layer of AlF3 coating on the surface of the LNMCO leads to a better capacity retention as illustrated in Figure 1. The surface layer coating may relieve the formation of spinel in the R 3 m phase. However, it cannot stop the formation of spinel in the C 2/ m , where the phase transformation proceeds through nucleation and growth process. More systematic work is needed to fully understand the mechanism of the surface coating on the lattice stability of cathode materials. |
| 21 | 7 | 8 | 9 | 80 | body_zone | column_2_of_2 | p7:body_region:1 | [283.92, 235.01, 201.32, 294.74] | The LNMO and LNMCO layered cathode materials consist of an intergrowth of LiMO2 R 3 m and Li2MO3 C 2/ m phases. Migration of TM cations into the Li layer initiated the transformation to spinel for the R 3 m phase region during cycling. However, the Li2MO3 phase releases the Li2O portion during high voltage cycling, resulting in the breakdown of the crystal lattices. As a result, lattice distortion/ amorphization, crack formation, and porosity formation are clearly observed as evidenced by the S/TEM imaging and EDS mapping. In this case, the layeredto-spinel phase transformation follows a nucleation and growth mechanism, which yields spinel clusters with di ff erent orientations in the distorted/amorphized lattices. Coatings of the surface of cathode particles with AlF3 may delay the formation of spinel in the R 3 m phase. Nevertheless, it cannot stop the formation of spinel in the C 2/ m phase, where the phase transformation proceeds through nucleation and growth of spinel domains inside the broken lattice upon cycling. The structural changes of the layered structures observed in this work are believed to be the main factors in fl uencing the capacity fading and poor rate performance of these layerstructured cathode materials. |
| 22 | 7 | 9 | 10 | 81 | bottom_margin | column_2_of_2 | p7:body_region:1 | [283.92, 576.24, 201.39, 168.31] | dissolved in ethyl carbonate (EC) and dimethyl carbonate (DMC) (1:2 in volume) as electrolyte in an argon- fi lled MBraun glovebox. The electrochemical performance tests were performed galvanostatically between 2.0 and 4.6 V at C /3 (1 C = 250 mA g 1 ) after three formation cycles at C /10 between 2.0 and 4.8 V on an Arbin BT-2000 battery tester at a controlled temperature of 30 ° C. Microstructures of the freshly prepared and electrochemically tested materials were analyzed using a probe-aberration corrected FEI Titan STEM and image-corrected FEI ETEMat 300 kV. The EDS maps were acquired using a 200 kV FEI Tecnai Osiris S/TEM microscope equipped with a FEI Super-X detector system, which combines four symmetrically placed Si drift detectors (SDD) around the objective lens with a highbrightness gun. This combination provides enhanced generation of X-rays and together with high detector e ffi ciency results in a faster mapping of larger areas in EDS maps. In this work, the EDS maps with 512 -512 pixels are obtained within less than 5 min. This helps to reduce specimen damage as the beam is not parked on any specimen region for a long period of time. The atomic |
| 23 | 8 | 1 | 1 | 86 | page_body | column_1_of_2 | p8:body_region:0 | [64.74, 67.99, 201.41, 33.66] | models are built using the VESTA software suite. The cycled samples are carried to the TEM within a sealed Ar atmosphere andtheturbo-pumpoftheS/TEMmicroscopeisprepumpedtofull speed so that the total air exposure time is less than 10 s. |