这里是差集:Docling 全量解析 text block 减去最终会进入正文的 block。优先人工检查 risk=high / medium。
layout_review.html excluded_blocks.json excluded_blocks.tsv final_body_blocks.tsv visual_assets.tsv original.pdf
{
  "parsed_text_blocks": 252,
  "final_body_blocks": 11,
  "excluded_blocks": {
    "count": 241,
    "by_reason": {
      "after_back_matter_stop": 199,
      "outside_body_flow_list_item": 9,
      "first_page_metadata": 6,
      "inside_front_matter": 5,
      "body_heading": 4,
      "docling_page_header": 3,
      "non_body_heading": 3,
      "front_matter_heading": 2,
      "page_margin_header": 2,
      "abstract_heading": 1,
      "back_matter_heading": 1,
      "docling_page_footer": 1,
      "inside_abstract": 1,
      "outside_body_flow": 1,
      "outside_body_flow_affiliation_block": 1,
      "outside_body_flow_caption": 1,
      "outside_body_flow_front_matter_heading": 1
    },
    "by_role_guess": {
      "reference": 65,
      "body_candidate_excluded": 56,
      "unknown_text": 18,
      "page_footer": 15,
      "page_header": 15,
      "caption": 14,
      "page_margin_header": 14,
      "body_heading": 11,
      "footnote": 7,
      "back_matter_heading": 6,
      "affiliation": 5,
      "front_matter_heading": 5,
      "back_matter_text": 4,
      "title_candidate": 3,
      "abstract_candidate": 1,
      "abstract_heading": 1,
      "metadata": 1
    },
    "by_risk_level": {
      "low": 171,
      "medium": 68,
      "high": 2
    },
    "high_risk_count": 2,
    "medium_risk_count": 68
  },
  "char_counts": {
    "parsed_text_chars": 74867,
    "final_body_chars": 9926,
    "excluded_chars": 64941
  }
}
{
  "truncated": true,
  "message": "Body extraction stopped at page 3 block #/texts/48#prov1: Supporting Information.. 199 following text blocks were excluded as after_back_matter_stop.",
  "stop_trigger": {
    "ref": "#/texts/48#prov1",
    "page": 3,
    "layout_order": 52,
    "role_guess": "back_matter_heading",
    "body_decision_reason": "back_matter_heading",
    "text_preview": "Supporting Information."
  },
  "first_truncated_block": {
    "ref": "#/texts/49",
    "page": 3,
    "layout_order": 53,
    "role_guess": "body_heading",
    "body_decision_reason": "after_back_matter_stop",
    "text_preview": "2.3. Electrochemical characterization"
  },
  "truncated_block_count": 199,
  "truncated_pages": [
    3,
    4,
    5,
    6,
    7,
    8,
    9,
    10,
    11,
    12,
    13,
    14,
    15
  ],
  "by_role_guess": {
    "reference": 64,
    "body_candidate_excluded": 56,
    "caption": 13,
    "page_footer": 13,
    "page_header": 12,
    "page_margin_header": 12,
    "body_heading": 7,
    "footnote": 6,
    "unknown_text": 6,
    "back_matter_heading": 5,
    "back_matter_text": 4,
    "affiliation": 1
  }
}
这些框显示被排除块,同时叠加真实图表资产框。青色虚线表示该 text block 被图表资产 caption 吸收;红色 STOP 是截断触发点,红色框是截断后被排除的块。
这是实际图表资产输出,不是审计层重新推断。
| # | type | label | page | caption source | suppressed | duplicate reason | rescue reason | group | confidence | bbox | caption |
|---|---|---|---|---|---|---|---|---|---|---|---|
| 1 | figure | Docling Figure 1 | 1 | missing_caption | 0.55 | [201.37, 315.18, 165.39, 155.28] | |||||
| 2 | figure | Docling Figure 2 | 1 | missing_caption | 0.55 | [372.12, 315.66, 165.28, 155.87] | |||||
| 3 | figure | Fig. 1 | 2 | direct_caption_ref | 0.82 | [39.5, 360.17, 247.89, 328.34] | Fig. 1. (a) Structural schematic of the Co-free Li-rich layered oxides generated using VESTA. (b) Thermogravimetric analysis (TGA) and derivative thermogravimetry (DTG) curves of the Li/Ni-incorporated precursors for L-NM 26, LNM 35, and L-NM 44 measured in air. The inset shows an enlarged view of the 330 -700 ◦ C region. | ||||
| 4 | figure | Fig. 2 | 4 | direct_caption_ref | 0.82 | [100.46, 339.11, 395.96, 366.01] | Fig. 2. Scanning electron micrograph of active materials (powders) after thermal treatment and before cycling in air atmosphere, along with the corresponding scaled-shaped individual particle size distributions displays on the right side. (a, b) L-NM 26, (c, d) L- NM 35 and (e, f) L-NM 44. The right-side plots are SEM-derived particle-size distributions from image analysis, not EDS depth profiles, etching profiles, or differential total-signal curves. | ||||
| 5 | figure | Fig. 3 | 5 | direct_caption_ref | 0.82 | [99.9, 370.84, 396.59, 316.23] | Fig. 3. Results of TEM and HRTEM study of the layer samples of active materials (powders) after thermal treatment and before cycling in air atmosphere, Fourier transform of TEM Images and local d-spacing Vector Variations for each sample at the right side. (a, b) Results of HRTEM and Local d-spacing vector variation of HRTEM for the sample L-NM 26, respectively (c, d) Results of HRTEM and Local d-spacing vector variation of HRTEM for the sample L-NM 44, respectively (e, f) LNM 35. Fast Fourier Transform-FFT images at the ride side of each HRTEM. Enlarge region embedded in each HRTEM image to show Stacking Fauls. Color-full bar dspacing in nm. (For interpretation of the references to color in this figure legend, the reader is referred to the Web version of this article.) | ||||
| 6 | figure | Fig. 4 | 7 | direct_caption_ref | 0.82 | [118.13, 56.15, 356.43, 332.12] | Fig. 4. Raman spectra of the L-NM 26, L-NM 35 and L-NM 44 active materials. The classified spectra are marked as S1 and S2 in Figs. S4 and S5. | ||||
| 7 | figure | Fig. 5 | 8 | direct_caption_ref | 0.82 | [117.5, 55.42, 361.57, 601.65] | Fig. 5. X-ray diffraction of the samples L-NM 26, L-NM 35 and L-NM 44. | ||||
| 8 | figure | Fig. 6 | 9 | direct_caption_ref | 0.82 | [98.63, 375.1, 397.06, 349.38] | Fig. 6. XPS spectra and high-resolution regions Ni2p, Mn2p, and O1s of the active materials L-NM 26, L-NM 35 and L-NM 44. | ||||
| 9 | figure | Fig. 7 | 11 | direct_caption_ref | 0.82 | [97.52, 55.62, 397.39, 494.99] | Fig. 7. (a) Charge -discharge voltage profiles of the L-NM 26, L-NM 35 and L-NM 44 between 2.0 and 4.8 V at a current density of 20 mA g 1 (0.1C) at room temperature and in the ride side the corresponding differential capacity curves for the cycles 1, 2, 30 and 80. (b) Cycling performance at 20 mA g 1 (0.1C) over a 2.0 -4.8 V voltage window is compared for the samples L-NM 26, L-NM 35 and L-NM 44. (c) Cycling stability curves performed at different C-rates over a 2.0 -4.8 V voltage window are compared for the samples L-NM 26, L-NM 35, L-NM 44, and L-NM 35, and L-NM 35 in CCCV mode. (d) Cycling performance of the Li1.2Ni0.3Mn0.5O2/graphite 18650 full cell, reported as full-cell discharge capacity (mAh) with the corresponding Coulombic efficiency over 32 cycles. | ||||
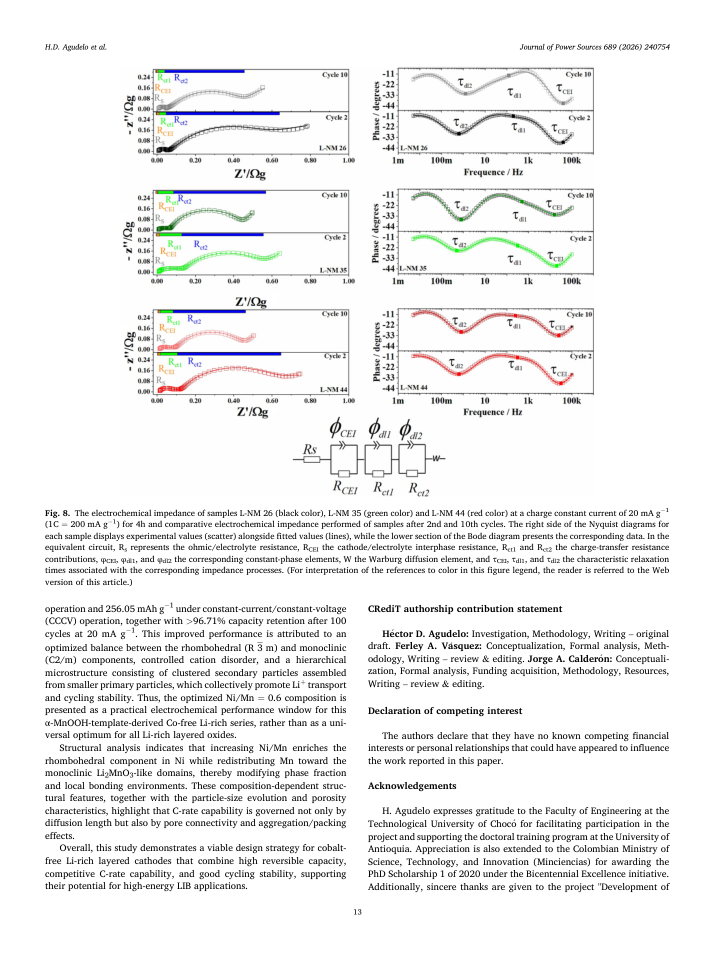
| 10 | figure | Fig. 8 | 13 | direct_caption_ref | 0.82 | [100.14, 55.42, 395.89, 359.3] | Fig. 8. The electrochemical impedance of samples L-NM 26 (black color), L-NM 35 (green color) and L-NM 44 (red color) at a charge constant current of 20 mA g 1 (1C = 200 mA g 1 ) for 4h and comparative electrochemical impedance performed of samples after 2nd and 10th cycles. The right side of the Nyquist diagrams for each sample displays experimental values (scatter) alongside fitted values (lines), while the lower section of the Bode diagram presents the corresponding data. In the equivalent circuit, Rs represents the ohmic/electrolyte resistance, RCEI the cathode/electrolyte interphase resistance, Rct1 and Rct2 the charge-transfer resistance contributions, φ CEI, φ dl1, and φ dl2 the corresponding constant-phase elements, W the Warburg diffusion element, and τ CEI, τ dl1, and τ dl2 the characteristic relaxation times associated with the corresponding impedance processes. (For interpretation of the references to color in this figure legend, the reader is referred to the Web version of this article.) | ||||
| 11 | table | Table 1 | 6 | sequence_or_inferred_caption | 0.82 | [36.24, 640.45, 252.79, 53.45] | Table 1 44 a . Results of chemical composition analysis by ICP of L-NM 26, L-NM 35 and L-NM | ||||
| 12 | table | Table 2 | 7 | direct_caption_ref | 0.82 | [36.5, 447.79, 521.94, 79.1] | Table 2 Lattice parameters of the R3m space group and phase quantification of the active materials L-NM 26, L-NM 35 and L-NM 44. | ||||
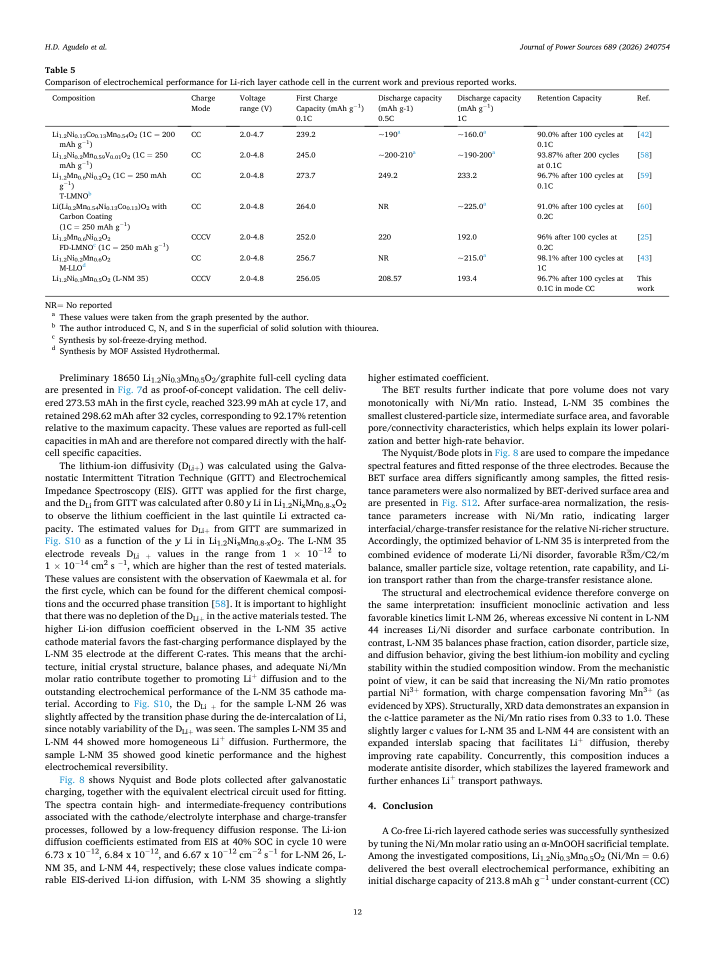
| 13 | table | Table 3 | 9 | direct_caption_ref | 0.82 | [36.43, 74.62, 521.41, 160.97] | Table 3 Crystallographic results from R3m space group a . | ||||
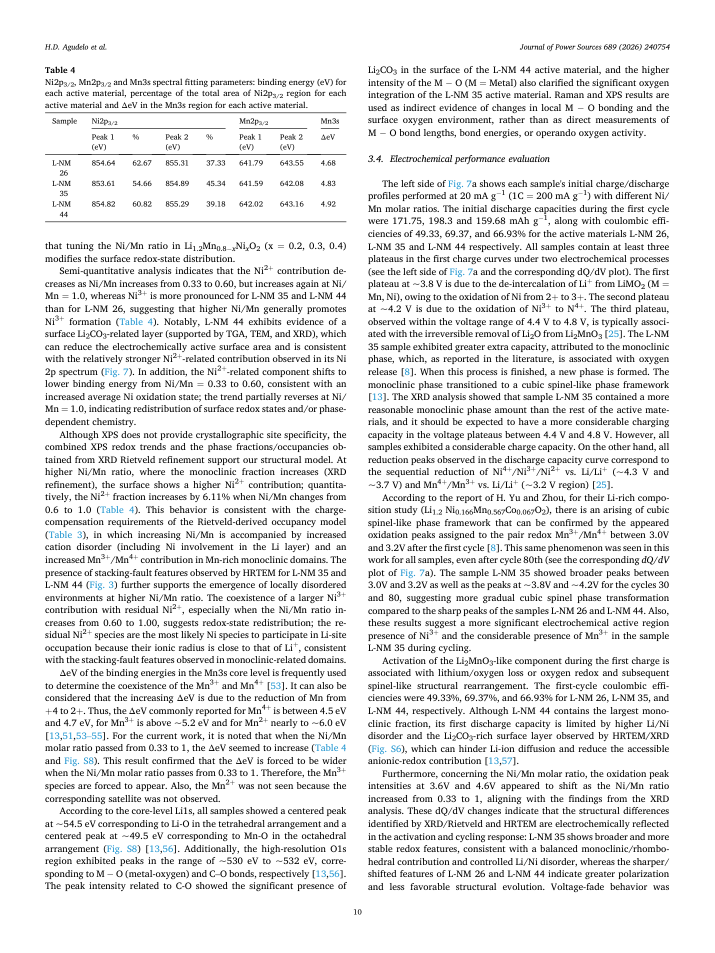
| 14 | table | Table 4 | 10 | direct_caption_ref | 0.82 | [36.62, 94.18, 251.96, 91.18] | Table 4 Ni2p3/2, Mn2p3/2 and Mn3s spectral fitting parameters: binding energy (eV) for each active material, percentage of the total area of Ni2p3/2 region for each active material and Δ eV in the Mn3s region for each active material. | ||||
| 15 | table | Table 5 | 12 | direct_caption_ref | 0.82 | [36.58, 73.86, 521.62, 173.25] | Table 5 Comparison of electrochemical performance for Li-rich layer cathode cell in the current work and previous reported works. |
| risk | page | order | label | role | reason | parser reason | production usage | trunc | body region | region | bg | bbox | raw text | cleaned text |
|---|---|---|---|---|---|---|---|---|---|---|---|---|---|---|
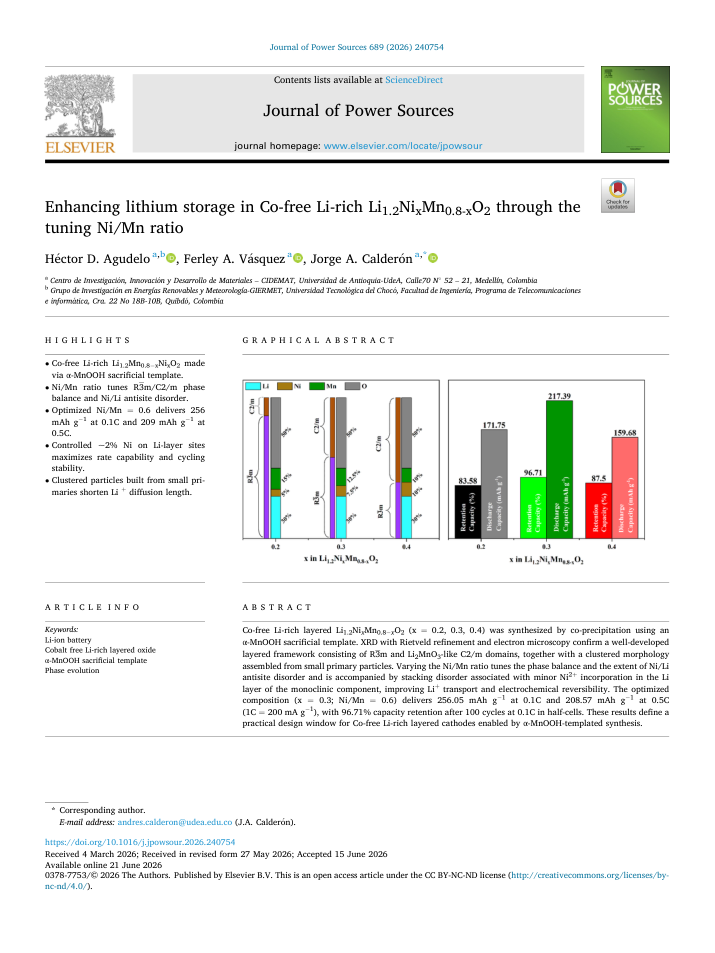
| high | 1 | 14 | list_item | unknown_text | outside_body_flow_list_item | outside_body_flow_list_item | p1:page_body:column_1_of_2:white | [255, 255, 255] white | [37.59, 339.43, 135.37, 25.74] | Optimized Ni/Mn = 0.6 delivers 256 mAh g 1 at 0.1C and 209 mAh g 1 at 0.5C. | Optimized Ni/Mn = 0.6 delivers 256 mAh g 1 at 0.1C and 209 mAh g 1 at 0.5C. | |||
| high | 1 | 15 | list_item | unknown_text | outside_body_flow_list_item | outside_body_flow_list_item | p1:page_body:column_1_of_2:white | [255, 255, 255] white | [37.59, 368.62, 135.33, 25.74] | Controlled ~2% Ni on Li-layer sites maximizes rate capability and cycling stability. | Controlled ~2% Ni on Li-layer sites maximizes rate capability and cycling stability. | |||
| medium | 1 | 6 | text | unknown_text | outside_body_flow | outside_body_flow | p1:page_body:column_1_of_2:white | [255, 255, 255] white | [37.59, 211.53, 13.1, 10.36] | H ´ | H ´ | |||
| medium | 1 | 8 | list_item | unknown_text | outside_body_flow_list_item | outside_body_flow_list_item | p1:page_body:column_1_of_2:white | [255, 255, 255] white | [37.59, 238.46, 2.65, 4.09] | b | b | |||
| medium | 1 | 12 | list_item | unknown_text | outside_body_flow_list_item | outside_body_flow_list_item | p1:page_body:column_1_of_2:white | [255, 255, 255] white | [37.59, 300.19, 135.35, 16.16] | Co-free Li-rich Li1.2Mn0.8 xNixO2 made via α -MnOOH sacrificial template. | Co-free Li-rich Li1.2Mn0.8 xNixO2 made via α -MnOOH sacrificial template. | |||
| medium | 1 | 13 | list_item | unknown_text | outside_body_flow_list_item | outside_body_flow_list_item | p1:page_body:column_1_of_2:white | [255, 255, 255] white | [37.59, 319.81, 135.33, 16.16] | Ni/Mn ratio tunes R3m/C2/m phase balance and Ni/Li antisite disorder. | Ni/Mn ratio tunes R3m/C2/m phase balance and Ni/Li antisite disorder. | |||
| medium | 1 | 16 | list_item | unknown_text | outside_body_flow_list_item | outside_body_flow_list_item | p1:page_body:column_1_of_2:white | [255, 255, 255] white | [37.59, 397.82, 133.23, 16.16] | Clustered particles built from small primaries shorten Li + diffusion length. | Clustered particles built from small primaries shorten Li + diffusion length. | |||
| medium | 1 | 22 | text | unknown_text | inside_front_matter | inside_front_matter | p1:page_body:column_1_of_2:white | [255, 255, 255] white | [37.52, 714.7, 29.86, 11.73] | Available | Available | |||
| medium | 1 | 23 | text | unknown_text | inside_front_matter | inside_front_matter | p1:page_body:column_1_of_2:white | [255, 255, 255] white | [69.48, 714.7, 19.85, 11.73] | online | online | |||
| medium | 1 | 24 | text | unknown_text | inside_front_matter | inside_front_matter | p1:page_body:column_1_of_2:white | [255, 255, 255] white | [91.44, 714.7, 8.08, 11.73] | 21 | 21 | |||
| medium | 1 | 25 | text | unknown_text | inside_front_matter | inside_front_matter | p1:page_body:column_1_of_2:white | [255, 255, 255] white | [101.62, 714.7, 15.14, 11.73] | June | June | |||
| medium | 1 | 26 | text | unknown_text | inside_front_matter | inside_front_matter | p1:page_body:column_1_of_2:white | [255, 255, 255] white | [118.85, 714.7, 16.15, 11.73] | 2026 | 2026 | |||
| medium | 1 | 29 | text | abstract_candidate | inside_abstract | inside_abstract | p1:page_body:column_2_of_2:white | [255, 255, 255] white | [202.0, 522.88, 357.79, 84.08] | Co-free Li-rich layered Li1.2Ni x Mn0.8 x O2 (x = 0.2, 0.3, 0.4) was synthesized by co-precipitation using an α -MnOOH sacrificial template. XRD with Rietveld refinement and electron microscopy confirm a well-developed layered framework consisting of R3m and Li2MnO3-like C2/m domains, together with a clustered morphology assembled from small primary particles. Varying the Ni/Mn ratio tunes the phase balance and the extent of Ni/Li antisite disorder and is accompanied by stacking disorder associated with minor Ni 2 + incorporation in the Li layer of the monoclinic component, improving Li + transport and electrochemical reversibility. The optimized composition (x = 0.3; Ni/Mn = 0.6) delivers 256.05 mAh g 1 at 0.1C and 208.57 mAh g 1 at 0.5C (1C = 200 mA g 1 ), with 96.71% capacity retention after 100 cycles at 0.1C in half-cells. These results define a practical design window for Co-free Li-rich layered cathodes enabled by α -MnOOH-templated synthesis. | Co-free Li-rich layered Li1.2Ni x Mn0.8 x O2 (x = 0.2, 0.3, 0.4) was synthesized by co-precipitation using an α -MnOOH sacrificial template. XRD with Rietveld refinement and electron microscopy confirm a well-developed layered framework consisting of R3m and Li2MnO3-like C2/m domains, together with a clustered morphology assembled from small primary particles. Varying the Ni/Mn ratio tunes the phase balance and the extent of Ni/Li antisite disorder and is accompanied by stacking disorder associated with minor Ni 2 + incorporation in the Li layer of the monoclinic component, improving Li + transport and electrochemical reversibility. The optimized composition (x = 0.3; Ni/Mn = 0.6) delivers 256.05 mAh g 1 at 0.1C and 208.57 mAh g 1 at 0.5C (1C = 200 mA g 1 ), with 96.71% capacity retention after 100 cycles at 0.1C in half-cells. These results define a practical design window for Co-free Li-rich layered cathodes enabled by α -MnOOH-templated synthesis. | |||
| medium | 3 | 54 | text | body_candidate_excluded | after_back_matter_stop | after_back_matter_stop | after_stop | p3:body_region:1 | p3:body_zone:column_2_of_2:white | [255, 255, 255] white | [306.59, 97.84, 253.43, 164.23] | Cathode slurries (80 wt% active material, 10 wt% Super P ® , 10 wt% PVDF) were prepared in N-methyl-2-pyrrolidone, doctor-blade coated onto Al foil, and vacuum-dried at 90 ◦ C for 24 h. Cycling stability was evaluated in CR2032 coin cells, and rate capability was assessed in three-electrode Swagelok cells to monitor the working-electrode potential (at ambient temperature ~25 ◦ C). Celgard separators were used for coin cells and GF/A (Whatman) for Swagelok cells; Li metal served as counter and reference electrodes. The electrolyte was 1.0 M LiPF6 in EC/ DMC (1:1 v/v). Cells were assembled in an Ar-filled MBraun glovebox (O2 < 1 ppm; Moisture < 0.5 ppm). Unless otherwise stated, the first 100 cycles were performed at 0.1C (1C = 200 mA g 1 ). All galvanostatic cycling and rate-capability tests were conducted over a 2.0-4.8 V voltage window vs. Li/Li + . For the 18650 validations, the Li1.2Ni0.3Mn0.5O2/ graphite cell used Celgard 2400 separator, 1.0 M LiPF6 in EC/DMC (1:1 v/v) electrolyte, vacuum drying at 90 ◦ C for 24 h, and formation at 4080 mA in the 2.5-4.5 V window. | Cathode slurries (80 wt% active material, 10 wt% Super P ® , 10 wt% PVDF) were prepared in N-methyl-2-pyrrolidone, doctor-blade coated onto Al foil, and vacuum-dried at 90 ◦ C for 24 h. Cycling stability was evaluated in CR2032 coin cells, and rate capability was assessed in three-electrode Swagelok cells to monitor the working-electrode potential (at ambient temperature ~25 ◦ C). Celgard separators were used for coin cells and GF/A (Whatman) for Swagelok cells; Li metal served as counter and reference electrodes. The electrolyte was 1.0 M LiPF6 in EC/ DMC (1:1 v/v). Cells were assembled in an Ar-filled MBraun glovebox (O2 < 1 ppm; Moisture < 0.5 ppm). Unless otherwise stated, the first 100 cycles were performed at 0.1C (1C = 200 mA g 1 ). All galvanostatic cycling and rate-capability tests were conducted over a 2.0-4.8 V voltage window vs. Li/Li + . For the 18650 validations, the Li1.2Ni0.3Mn0.5O2/ graphite cell used Celgard 2400 separator, 1.0 M LiPF6 in EC/DMC (1:1 v/v) electrolyte, vacuum drying at 90 ◦ C for 24 h, and formation at 4080 mA in the 2.5-4.5 V window. | |
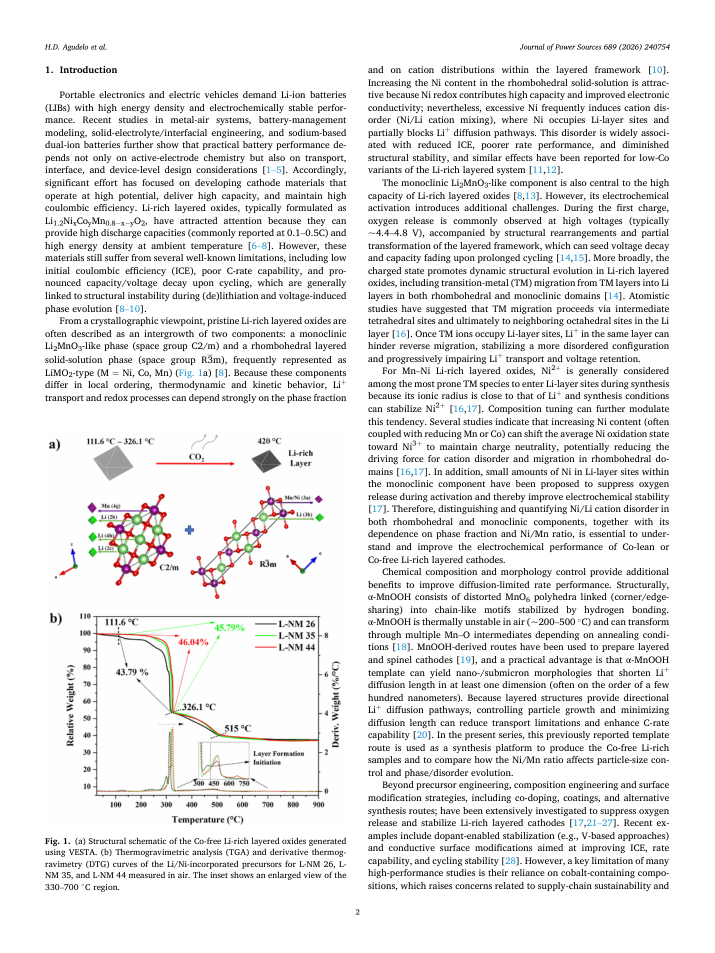
| medium | 3 | 57 | text | body_candidate_excluded | after_back_matter_stop | after_back_matter_stop | after_stop | p3:body_region:1 | p3:body_zone:column_2_of_2:white | [255, 255, 255] white | [306.6, 317.63, 253.42, 111.91] | Thermogravimetric analysis (TGA) was conducted on the Li/Niincorporated precursors (Section 3) to confirm the thermal events associated with layered-phase formation. Differential scanning calorimetry (DSC) was additionally performed to identify the temperature range for layered-structure formation and to support the selection of the final calcination conditions. Fig. 1a illustrates the proposed reaction pathway and structural arrangement during thermal treatment (structures rendered in VESTA), while Fig. 1b shows the corresponding TGA and differential thermal analysis (DTA) curves for the precursors obtained after incorporation of lithium and nickel into the α -MnOOH nanorod template. | Thermogravimetric analysis (TGA) was conducted on the Li/Niincorporated precursors (Section 3) to confirm the thermal events associated with layered-phase formation. Differential scanning calorimetry (DSC) was additionally performed to identify the temperature range for layered-structure formation and to support the selection of the final calcination conditions. Fig. 1a illustrates the proposed reaction pathway and structural arrangement during thermal treatment (structures rendered in VESTA), while Fig. 1b shows the corresponding TGA and differential thermal analysis (DTA) curves for the precursors obtained after incorporation of lithium and nickel into the α -MnOOH nanorod template. | |
| medium | 3 | 58 | text | body_candidate_excluded | after_back_matter_stop | after_back_matter_stop | after_stop | p3:body_region:1 | p3:body_zone:column_2_of_2:white | [255, 255, 255] white | [306.6, 431.44, 253.41, 113.19] | The TGA curves show a continuous mass loss up to 515 ◦ C, reaching 43.79%, 45.79%, and 46.04% for L-NM 26, L-NM 35, and L-NM 44, respectively. Three main mass-loss stages are observed below 515 ◦ C. The first stage occurs between 25 ◦ C and 111.6 ◦ C, which is attributed to solvent removal. The second stage extends from 116 ◦ C to 326.1 ◦ C and is assigned to oxidation/decomposition of organic species. The associated critical points in this second region are observed on the DTA curves at 312.6 ◦ C (L-NM 26), 319.3 ◦ C (L-NM 35), and 324.18 ◦ C (L-NM 44). Consistently, the DSC curve of L-NM 35 exhibits an exothermic peak centered at 328 ◦ C, confirming the organic decomposition event (Fig. S1). | The TGA curves show a continuous mass loss up to 515 ◦ C, reaching 43.79%, 45.79%, and 46.04% for L-NM 26, L-NM 35, and L-NM 44, respectively. Three main mass-loss stages are observed below 515 ◦ C. The first stage occurs between 25 ◦ C and 111.6 ◦ C, which is attributed to solvent removal. The second stage extends from 116 ◦ C to 326.1 ◦ C and is assigned to oxidation/decomposition of organic species. The associated critical points in this second region are observed on the DTA curves at 312.6 ◦ C (L-NM 26), 319.3 ◦ C (L-NM 35), and 324.18 ◦ C (L-NM 44). Consistently, the DSC curve of L-NM 35 exhibits an exothermic peak centered at 328 ◦ C, confirming the organic decomposition event (Fig. S1). | |
| medium | 3 | 59 | text | body_candidate_excluded | after_back_matter_stop | after_back_matter_stop | after_stop | p3:body_region:1 | p3:body_zone:column_2_of_2:white | [255, 255, 255] white | [306.6, 546.52, 253.42, 144.54] | The third mass-loss stage is observed between 326.1 ◦ C and 515 ◦ C, corresponding to the onset of formation of the Li1.2Mn0.8 x Ni x O2 (x = 0.2, 0.3, 0.4) layered phase. DSC further supports this assignment: for L-NM 35, an endothermic peak is detected at 509 ◦ C (Fig. S1). A related layered-oxide system, LiNi0.5Mn0.5O2, was reported to form at approximately 460 ◦ C using a comparable synthesis route [13]. The higher Li content in the present compositions (Li excess of 20%) therefore appears to shift the onset of layered-phase formation to higher temperature. Following the initial phase formation, crystallization proceeds with oxygen incorporation into the structure, as discussed by Ma et al. and Jouybari et al. [30,31]. In agreement with this interpretation, the DSC curve of L-NM 35 shows a small exothermic feature with a maximum at 534 ◦ C, which is attributed to oxygen integration after layered-phase formation (Fig. S1). | The third mass-loss stage is observed between 326.1 ◦ C and 515 ◦ C, corresponding to the onset of formation of the Li1.2Mn0.8 x Ni x O2 (x = 0.2, 0.3, 0.4) layered phase. DSC further supports this assignment: for L-NM 35, an endothermic peak is detected at 509 ◦ C (Fig. S1). A related layered-oxide system, LiNi0.5Mn0.5O2, was reported to form at approximately 460 ◦ C using a comparable synthesis route [13]. The higher Li content in the present compositions (Li excess of 20%) therefore appears to shift the onset of layered-phase formation to higher temperature. Following the initial phase formation, crystallization proceeds with oxygen incorporation into the structure, as discussed by Ma et al. and Jouybari et al. [30,31]. In agreement with this interpretation, the DSC curve of L-NM 35 shows a small exothermic feature with a maximum at 534 ◦ C, which is attributed to oxygen integration after layered-phase formation (Fig. S1). | |
| medium | 3 | 60 | text | body_candidate_excluded | after_back_matter_stop | after_back_matter_stop | after_stop | p3:body_region:1 | p3:bottom_margin:column_2_of_2:white | [255, 255, 255] white | [306.6, 692.96, 253.42, 50.43] | At higher temperatures, a minor mass loss between 650 ◦ C and 750 ◦ C is attributed to decomposition of residual Li2CO3, yielding 0.42%, 0.59%, and 1.09% for L-NM 26, L-NM 35, and L-NM 44, respectively (see the enlarged inset region in Fig. 1b) [32]. Notably, L-NM 44 exhibits the most pronounced mass loss in this region, | At higher temperatures, a minor mass loss between 650 ◦ C and 750 ◦ C is attributed to decomposition of residual Li2CO3, yielding 0.42%, 0.59%, and 1.09% for L-NM 26, L-NM 35, and L-NM 44, respectively (see the enlarged inset region in Fig. 1b) [32]. Notably, L-NM 44 exhibits the most pronounced mass loss in this region, | |
| medium | 4 | 64 | text | body_candidate_excluded | after_back_matter_stop | after_back_matter_stop | after_stop | p4:body_region:0 | p4:top_margin:column_1_of_2:white | [255, 255, 255] white | [37.59, 55.48, 253.45, 59.64] | consistent with a higher carbonate residue (see the enlarged region between 300 ◦ C and 800 ◦ C in the inset of Fig. 1b). Finally, because layered oxides are commonly calcined in the range 700 -950 ◦ C to obtain adequate crystallinity, an essential factor governing electrochemical performance [33 -35], a final thermal treatment at 800 ◦ C was selected for phase development in this study. | consistent with a higher carbonate residue (see the enlarged region between 300 ◦ C and 800 ◦ C in the inset of Fig. 1b). Finally, because layered oxides are commonly calcined in the range 700 -950 ◦ C to obtain adequate crystallinity, an essential factor governing electrochemical performance [33 -35], a final thermal treatment at 800 ◦ C was selected for phase development in this study. | |
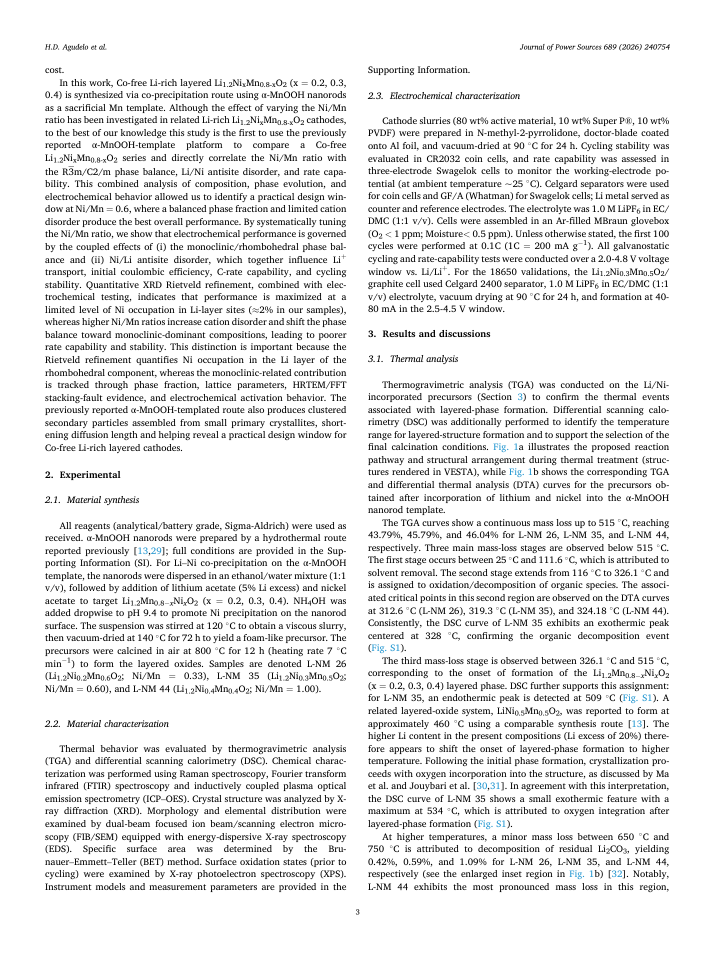
| medium | 4 | 66 | text | body_candidate_excluded | after_back_matter_stop | after_back_matter_stop | after_stop | p4:body_region:0 | p4:body_zone:column_1_of_2:white | [255, 255, 255] white | [37.59, 157.64, 253.45, 70.07] | SEM micrographs (Fig. 2) show the morphology of Co-free Li-rich layered cathodes synthesized from the α -MnOOH nanorod template at different Ni/Mn molar ratios. The rod-like morphology of the α -MnOOH precursor is confirmed in Fig. S2. In all compositions, the powders consist of large clustered secondary particles assembled from irregular scale-shaped primary particles, indicating that the template-assisted route promotes hierarchical aggregation rather than uniform faceting. | SEM micrographs (Fig. 2) show the morphology of Co-free Li-rich layered cathodes synthesized from the α -MnOOH nanorod template at different Ni/Mn molar ratios. The rod-like morphology of the α -MnOOH precursor is confirmed in Fig. S2. In all compositions, the powders consist of large clustered secondary particles assembled from irregular scale-shaped primary particles, indicating that the template-assisted route promotes hierarchical aggregation rather than uniform faceting. | |
| medium | 4 | 67 | text | body_candidate_excluded | after_back_matter_stop | after_back_matter_stop | after_stop | p4:body_region:0 | p4:body_zone:column_1_of_2:white | [255, 255, 255] white | [37.59, 230.83, 253.44, 91.05] | For L-NM 26, the clustered particles exhibit an average length of 3.141 ± 1.87 μ m (Fig. 2a), while the scale-shaped primary particles show an average length of 461.20 ± 188 nm (Fig. 2b). For L-NM 35, the clustered particle length decreases to 1.620 ± 0.74 μ m (Fig. 2c), and the primary particle length distribution yields 256.59 ± 117 nm (Fig. 2d). For L-NM 44, the clustered particles recover a larger average length of 3.069 ± 1.4 μ m (Fig. 2e), with scale-shaped primaries of 372.57 ± 98 nm (Fig. 2f). Overall, the primary particle size decreases when the Ni/Mn ratio increases from 0.33 to 0.60, while the change from 0.60 to 1.00 | For L-NM 26, the clustered particles exhibit an average length of 3.141 ± 1.87 μ m (Fig. 2a), while the scale-shaped primary particles show an average length of 461.20 ± 188 nm (Fig. 2b). For L-NM 35, the clustered particle length decreases to 1.620 ± 0.74 μ m (Fig. 2c), and the primary particle length distribution yields 256.59 ± 117 nm (Fig. 2d). For L-NM 44, the clustered particles recover a larger average length of 3.069 ± 1.4 μ m (Fig. 2e), with scale-shaped primaries of 372.57 ± 98 nm (Fig. 2f). Overall, the primary particle size decreases when the Ni/Mn ratio increases from 0.33 to 0.60, while the change from 0.60 to 1.00 | |
| medium | 4 | 68 | text | body_candidate_excluded | after_back_matter_stop | after_back_matter_stop | after_stop | p4:body_region:1 | p4:top_margin:column_2_of_2:white | [255, 255, 255] white | [306.59, 55.49, 253.42, 38.72] | produces a less pronounced additional reduction, consistent with the SEM observations. Notably, L-NM 35 displays the most uniform cluster length (lowest standard deviation), suggesting a narrower aggregation distribution than the other samples. | produces a less pronounced additional reduction, consistent with the SEM observations. Notably, L-NM 35 displays the most uniform cluster length (lowest standard deviation), suggesting a narrower aggregation distribution than the other samples. | |
| medium | 4 | 69 | text | body_candidate_excluded | after_back_matter_stop | after_back_matter_stop | after_stop | p4:body_region:1 | p4:front_matter:column_2_of_2:white | [255, 255, 255] white | [306.59, 97.33, 253.42, 153.75] | BET measurements were performed to quantify the influence of Ni/ Mn ratio on surface properties. The specific surface area increases monotonically from 9.33 m 2 g 1 (L-NM26) to 19.67 m 2 g 1 (L-NM 35) and 28.66 m 2 g 1 (L-NM 44). The corresponding BET-derived ' equivalent ' particle sizes are 642.79 nm, 304.91 nm, and 209.36 nm, respectively, supporting the SEM trend of decreasing characteristic particle size with increasing Ni/Mn ratio. The pore volume, however, is nonmonotonic: 0.00122 cm 3 g 1 (L-NM 26) decreases to 0.00044 cm 3 g 1 (L-NM 35) and then increases slightly to 0.00121 cm 3 g 1 (L-NM 44). This indicates that pore development does not scale linearly with surface area and is likely governed by the competing effects of primary-particle size and secondary-particle packing/aggregation. The smallest cluster size in L-NM 35 is consistent with its intermediate surface area and its reduced pore volume, highlighting the complex interplay among clustering, surface area, and porosity. | BET measurements were performed to quantify the influence of Ni/ Mn ratio on surface properties. The specific surface area increases monotonically from 9.33 m 2 g 1 (L-NM26) to 19.67 m 2 g 1 (L-NM 35) and 28.66 m 2 g 1 (L-NM 44). The corresponding BET-derived ' equivalent ' particle sizes are 642.79 nm, 304.91 nm, and 209.36 nm, respectively, supporting the SEM trend of decreasing characteristic particle size with increasing Ni/Mn ratio. The pore volume, however, is nonmonotonic: 0.00122 cm 3 g 1 (L-NM 26) decreases to 0.00044 cm 3 g 1 (L-NM 35) and then increases slightly to 0.00121 cm 3 g 1 (L-NM 44). This indicates that pore development does not scale linearly with surface area and is likely governed by the competing effects of primary-particle size and secondary-particle packing/aggregation. The smallest cluster size in L-NM 35 is consistent with its intermediate surface area and its reduced pore volume, highlighting the complex interplay among clustering, surface area, and porosity. | |
| medium | 4 | 70 | text | body_candidate_excluded | after_back_matter_stop | after_back_matter_stop | after_stop | p4:body_region:1 | p4:body_zone:column_2_of_2:white | [255, 255, 255] white | [306.6, 254.25, 253.41, 59.58] | The local chemical distribution was examined by EDS mapping (right panels in Fig. 2a, c, and 2e; quantitative composition in Table S1). For LNM 35 and L-NM 44, the clustered particles display lateral compositional heterogeneity across the projected particle surface, with regions of different Mn/Ni ratios (see Tables S4, S5, S7, and S8). Because SEMEDS analyzes the projected surface of three-dimensional particles, these | The local chemical distribution was examined by EDS mapping (right panels in Fig. 2a, c, and 2e; quantitative composition in Table S1). For LNM 35 and L-NM 44, the clustered particles display lateral compositional heterogeneity across the projected particle surface, with regions of different Mn/Ni ratios (see Tables S4, S5, S7, and S8). Because SEMEDS analyzes the projected surface of three-dimensional particles, these | |
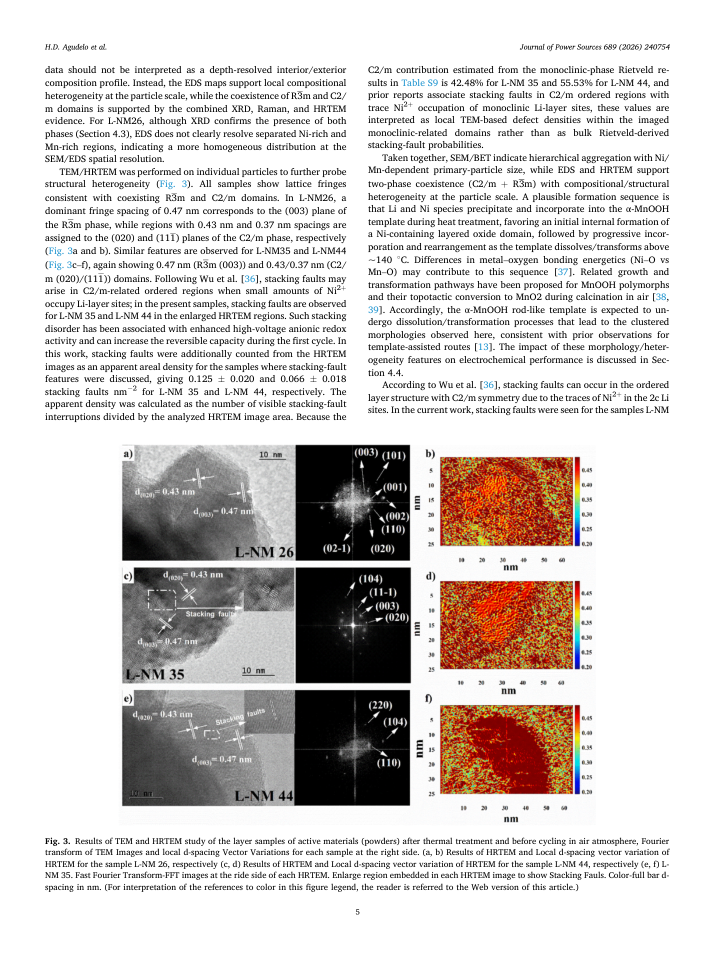
| medium | 5 | 76 | text | body_candidate_excluded | after_back_matter_stop | after_back_matter_stop | after_stop | p5:body_region:0 | p5:page_body:column_1_of_2:white | [255, 255, 255] white | [37.59, 140.24, 253.44, 211.52] | TEM/HRTEM was performed on individual particles to further probe structural heterogeneity (Fig. 3). All samples show lattice fringes consistent with coexisting R3m and C2/m domains. In L-NM26, a dominant fringe spacing of 0.47 nm corresponds to the (003) plane of the R3m phase, while regions with 0.43 nm and 0.37 nm spacings are assigned to the (020) and (111) planes of the C2/m phase, respectively (Fig. 3a and b). Similar features are observed for L-NM35 and L-NM44 (Fig. 3c -f), again showing 0.47 nm (R3m (003)) and 0.43/0.37 nm (C2/ m (020)/(111)) domains. Following Wu et al. [36], stacking faults may arise in C2/m-related ordered regions when small amounts of Ni 2 + occupy Li-layer sites; in the present samples, stacking faults are observed for L-NM 35 and L-NM 44 in the enlarged HRTEM regions. Such stacking disorder has been associated with enhanced high-voltage anionic redox activity and can increase the reversible capacity during the first cycle. In this work, stacking faults were additionally counted from the HRTEM images as an apparent areal density for the samples where stacking-fault features were discussed, giving 0.125 ± 0.020 and 0.066 ± 0.018 stacking faults nm 2 for L-NM 35 and L-NM 44, respectively. The apparent density was calculated as the number of visible stacking-fault interruptions divided by the analyzed HRTEM image area. Because the | TEM/HRTEM was performed on individual particles to further probe structural heterogeneity (Fig. 3). All samples show lattice fringes consistent with coexisting R3m and C2/m domains. In L-NM26, a dominant fringe spacing of 0.47 nm corresponds to the (003) plane of the R3m phase, while regions with 0.43 nm and 0.37 nm spacings are assigned to the (020) and (111) planes of the C2/m phase, respectively (Fig. 3a and b). Similar features are observed for L-NM35 and L-NM44 (Fig. 3c -f), again showing 0.47 nm (R3m (003)) and 0.43/0.37 nm (C2/ m (020)/(111)) domains. Following Wu et al. [36], stacking faults may arise in C2/m-related ordered regions when small amounts of Ni 2 + occupy Li-layer sites; in the present samples, stacking faults are observed for L-NM 35 and L-NM 44 in the enlarged HRTEM regions. Such stacking disorder has been associated with enhanced high-voltage anionic redox activity and can increase the reversible capacity during the first cycle. In this work, stacking faults were additionally counted from the HRTEM images as an apparent areal density for the samples where stacking-fault features were discussed, giving 0.125 ± 0.020 and 0.066 ± 0.018 stacking faults nm 2 for L-NM 35 and L-NM 44, respectively. The apparent density was calculated as the number of visible stacking-fault interruptions divided by the analyzed HRTEM image area. Because the | |
| medium | 5 | 77 | text | body_candidate_excluded | after_back_matter_stop | after_back_matter_stop | after_stop | p5:body_region:1 | p5:top_margin:column_2_of_2:white | [255, 255, 255] white | [306.59, 55.49, 253.41, 70.07] | C2/m contribution estimated from the monoclinic-phase Rietveld results in Table S9 is 42.48% for L-NM 35 and 55.53% for L-NM 44, and prior reports associate stacking faults in C2/m ordered regions with trace Ni 2 + occupation of monoclinic Li-layer sites, these values are interpreted as local TEM-based defect densities within the imaged monoclinic-related domains rather than as bulk Rietveld-derived stacking-fault probabilities. | C2/m contribution estimated from the monoclinic-phase Rietveld results in Table S9 is 42.48% for L-NM 35 and 55.53% for L-NM 44, and prior reports associate stacking faults in C2/m ordered regions with trace Ni 2 + occupation of monoclinic Li-layer sites, these values are interpreted as local TEM-based defect densities within the imaged monoclinic-related domains rather than as bulk Rietveld-derived stacking-fault probabilities. | |
| medium | 5 | 78 | text | body_candidate_excluded | after_back_matter_stop | after_back_matter_stop | after_stop | p5:body_region:1 | p5:page_body:column_2_of_2:white | [255, 255, 255] white | [306.6, 128.73, 253.44, 186.23] | Taken together, SEM/BET indicate hierarchical aggregation with Ni/ Mn-dependent primary-particle size, while EDS and HRTEM support two-phase coexistence (C2/m + R3m) with compositional/structural heterogeneity at the particle scale. A plausible formation sequence is that Li and Ni species precipitate and incorporate into the α -MnOOH template during heat treatment, favoring an initial internal formation of a Ni-containing layered oxide domain, followed by progressive incorporation and rearrangement as the template dissolves/transforms above ~140 ◦ C. Differences in metal -oxygen bonding energetics (Ni -O vs Mn -O) may contribute to this sequence [37]. Related growth and transformation pathways have been proposed for MnOOH polymorphs and their topotactic conversion to MnO2 during calcination in air [38, 39]. Accordingly, the α -MnOOH rod-like template is expected to undergo dissolution/transformation processes that lead to the clustered morphologies observed here, consistent with prior observations for template-assisted routes [13]. The impact of these morphology/heterogeneity features on electrochemical performance is discussed in Section 4.4. | Taken together, SEM/BET indicate hierarchical aggregation with Ni/ Mn-dependent primary-particle size, while EDS and HRTEM support two-phase coexistence (C2/m + R3m) with compositional/structural heterogeneity at the particle scale. A plausible formation sequence is that Li and Ni species precipitate and incorporate into the α -MnOOH template during heat treatment, favoring an initial internal formation of a Ni-containing layered oxide domain, followed by progressive incorporation and rearrangement as the template dissolves/transforms above ~140 ◦ C. Differences in metal -oxygen bonding energetics (Ni -O vs Mn -O) may contribute to this sequence [37]. Related growth and transformation pathways have been proposed for MnOOH polymorphs and their topotactic conversion to MnO2 during calcination in air [38, 39]. Accordingly, the α -MnOOH rod-like template is expected to undergo dissolution/transformation processes that lead to the clustered morphologies observed here, consistent with prior observations for template-assisted routes [13]. The impact of these morphology/heterogeneity features on electrochemical performance is discussed in Section 4.4. | |
| medium | 5 | 79 | text | body_candidate_excluded | after_back_matter_stop | after_back_matter_stop | after_stop | p5:body_region:1 | p5:page_body:column_2_of_2:white | [255, 255, 255] white | [306.6, 318.08, 253.41, 28.23] | According to Wu et al. [36], stacking faults can occur in the ordered layer structure with C2/m symmetry due to the traces of Ni 2 + in the 2c Li sites. In the current work, stacking faults were seen for the samples L-NM | According to Wu et al. [36], stacking faults can occur in the ordered layer structure with C2/m symmetry due to the traces of Ni 2 + in the 2c Li sites. In the current work, stacking faults were seen for the samples L-NM | |
| medium | 6 | 84 | text | body_candidate_excluded | after_back_matter_stop | after_back_matter_stop | after_stop | p6:body_region:0 | p6:top_margin:column_1_of_2:white | [255, 255, 255] white | [37.59, 55.48, 253.44, 28.23] | 35 and L-NM 44, as the enlarged region embedded in the HRTEM images showed. Furthermore, stacking faults enhance the high-voltage anionic redox activity, increasing the reversible capacity in the first cycle. | 35 and L-NM 44, as the enlarged region embedded in the HRTEM images showed. Furthermore, stacking faults enhance the high-voltage anionic redox activity, increasing the reversible capacity in the first cycle. | |
| medium | 6 | 85 | text | body_candidate_excluded | after_back_matter_stop | after_back_matter_stop | after_stop | p6:body_region:0 | p6:front_matter:column_1_of_2:white | [255, 255, 255] white | [37.59, 86.89, 253.45, 259.42] | The above results indicated that two phases with spatial groups C2/ m and R3m coexist in the particles of all synthesized samples. Accordingly, the EDS results are discussed here as evidence of lateral surface compositional heterogeneity rather than as direct proof of bulk-depth segregation. A plausible formation pathway is that Li and Ni species precipitate onto and interact with the α -MnOOH template during thermal treatment, followed by progressive incorporation and rearrangement as the template transforms to form the layered oxide particles. This can be explained by the fact that the average energy of bond dissociation of the Ni-O is lesser than that of the Mn-O, owing to the cation metal amount at different oxidation states in the solid solution [37]. Therefore, the first octahedral arrangement in the layer structure is given by Ni-O, corresponding to the rhombohedral. As was described in the experimental section, the α -MnOOH nanorods are obtained at 140 ◦ C. This compound begins to dissolve at temperature superior to 140 ◦ C to form layer particles with different morphologic characteristics. Lan et al. [39] proposed a growth mechanism for γ -MnOOH, which can be calcined at around ~400 ◦ C to form intercalation compounds such as MnO2. Moreover, according to the observation of Kohler et al. [38] the topotactic relation is preserved in α -MnOOH (groutite) and γ -MnOOH (manganite) when these are transformed into pyrolusite ( β -MnO2) in air atmosphere during a thermal treatment. Therefore, the rod-like particles of the α -MnOOH template are expected to have the same dissolution mechanism to form the clustered particles of the layer materials observed in this study and by Agudelo et al. [13]. | The above results indicated that two phases with spatial groups C2/ m and R3m coexist in the particles of all synthesized samples. Accordingly, the EDS results are discussed here as evidence of lateral surface compositional heterogeneity rather than as direct proof of bulk-depth segregation. A plausible formation pathway is that Li and Ni species precipitate onto and interact with the α -MnOOH template during thermal treatment, followed by progressive incorporation and rearrangement as the template transforms to form the layered oxide particles. This can be explained by the fact that the average energy of bond dissociation of the Ni-O is lesser than that of the Mn-O, owing to the cation metal amount at different oxidation states in the solid solution [37]. Therefore, the first octahedral arrangement in the layer structure is given by Ni-O, corresponding to the rhombohedral. As was described in the experimental section, the α -MnOOH nanorods are obtained at 140 ◦ C. This compound begins to dissolve at temperature superior to 140 ◦ C to form layer particles with different morphologic characteristics. Lan et al. [39] proposed a growth mechanism for γ -MnOOH, which can be calcined at around ~400 ◦ C to form intercalation compounds such as MnO2. Moreover, according to the observation of Kohler et al. [38] the topotactic relation is preserved in α -MnOOH (groutite) and γ -MnOOH (manganite) when these are transformed into pyrolusite ( β -MnO2) in air atmosphere during a thermal treatment. Therefore, the rod-like particles of the α -MnOOH template are expected to have the same dissolution mechanism to form the clustered particles of the layer materials observed in this study and by Agudelo et al. [13]. | |
| medium | 6 | 87 | text | body_candidate_excluded | after_back_matter_stop | after_back_matter_stop | after_stop | p6:body_region:0 | p6:body_zone:column_1_of_2:white | [255, 255, 255] white | [37.59, 391.05, 253.44, 101.48] | Chemical composition was quantified by inductively coupled plasma optical emission spectrometry (ICP -OES) to determine Li and transitionmetal contents, while Raman spectroscopy was used to probe local vibrational environments. The ICP -OES results (Table 1) are close to the nominal synthesis stoichiometries, and SEM -EDS provides consistent elemental ratios (Fig. S3 -S5). Among the analyzed samples, L-NM 44 shows the lowest measured Li content. This observation is interpreted cautiously and discussed together with the thermal-analysis results in Section 4.1, rather than as an independent quantitative proof of progressive Li loss during calcination. | Chemical composition was quantified by inductively coupled plasma optical emission spectrometry (ICP -OES) to determine Li and transitionmetal contents, while Raman spectroscopy was used to probe local vibrational environments. The ICP -OES results (Table 1) are close to the nominal synthesis stoichiometries, and SEM -EDS provides consistent elemental ratios (Fig. S3 -S5). Among the analyzed samples, L-NM 44 shows the lowest measured Li content. This observation is interpreted cautiously and discussed together with the thermal-analysis results in Section 4.1, rather than as an independent quantitative proof of progressive Li loss during calcination. | |
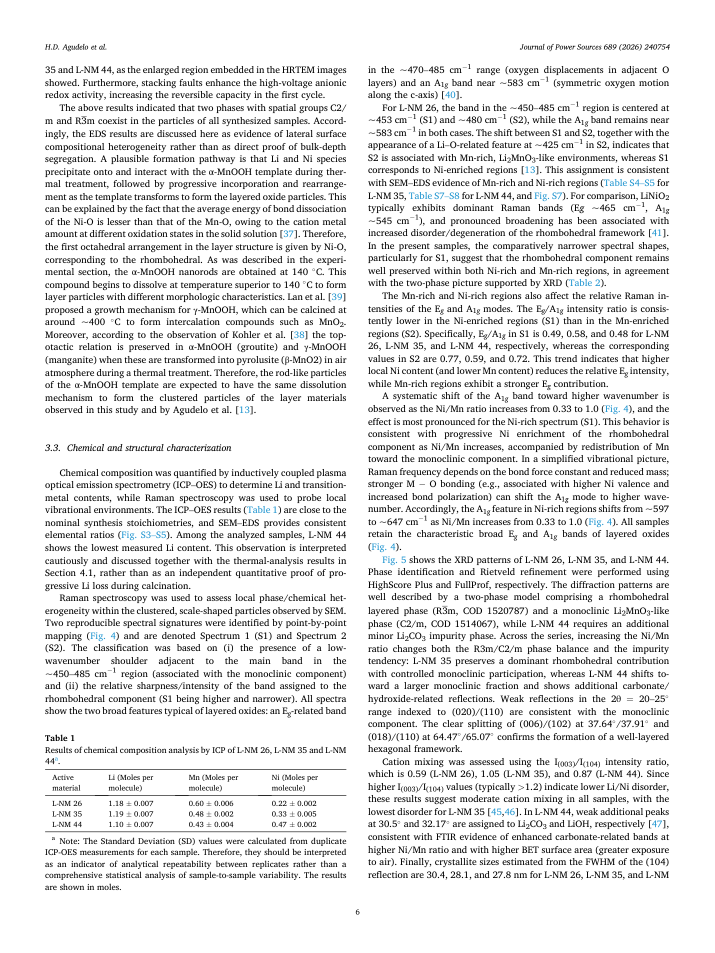
| medium | 6 | 88 | text | body_candidate_excluded | after_back_matter_stop | after_back_matter_stop | after_stop | p6:body_region:0 | p6:body_zone:column_1_of_2:white | [255, 255, 255] white | [37.59, 495.7, 253.44, 102.29] | Raman spectroscopy was used to assess local phase/chemical heterogeneity within the clustered, scale-shaped particles observed by SEM. Two reproducible spectral signatures were identified by point-by-point mapping (Fig. 4) and are denoted Spectrum 1 (S1) and Spectrum 2 (S2). The classification was based on (i) the presence of a lowwavenumber shoulder adjacent to the main band in the ~450 -485 cm 1 region (associated with the monoclinic component) and (ii) the relative sharpness/intensity of the band assigned to the rhombohedral component (S1 being higher and narrower). All spectra show the two broad features typical of layered oxides: an E g -related band | Raman spectroscopy was used to assess local phase/chemical heterogeneity within the clustered, scale-shaped particles observed by SEM. Two reproducible spectral signatures were identified by point-by-point mapping (Fig. 4) and are denoted Spectrum 1 (S1) and Spectrum 2 (S2). The classification was based on (i) the presence of a lowwavenumber shoulder adjacent to the main band in the ~450 -485 cm 1 region (associated with the monoclinic component) and (ii) the relative sharpness/intensity of the band assigned to the rhombohedral component (S1 being higher and narrower). All spectra show the two broad features typical of layered oxides: an E g -related band | |
| medium | 6 | 91 | text | body_candidate_excluded | after_back_matter_stop | after_back_matter_stop | after_stop | p6:body_region:0 | p6:bottom_margin:column_1_of_2:white | [255, 255, 255] white | [37.59, 696.56, 253.2, 46.58] | a Note: The Standard Deviation (SD) values were calculated from duplicate ICP-OES measurements for each sample. Therefore, they should be interpreted as an indicator of analytical repeatability between replicates rather than a comprehensive statistical analysis of sample-to-sample variability. The results are shown in moles. | a Note: The Standard Deviation (SD) values were calculated from duplicate ICP-OES measurements for each sample. Therefore, they should be interpreted as an indicator of analytical repeatability between replicates rather than a comprehensive statistical analysis of sample-to-sample variability. The results are shown in moles. | |
| medium | 6 | 92 | text | body_candidate_excluded | after_back_matter_stop | after_back_matter_stop | after_stop | p6:body_region:1 | p6:top_margin:column_2_of_2:white | [255, 255, 255] white | [306.59, 53.31, 253.41, 30.41] | in the ~470 -485 cm 1 range (oxygen displacements in adjacent O layers) and an A1 g band near ~583 cm 1 (symmetric oxygen motion along the c-axis) [40]. | in the ~470 -485 cm 1 range (oxygen displacements in adjacent O layers) and an A1 g band near ~583 cm 1 (symmetric oxygen motion along the c-axis) [40]. | |
| medium | 6 | 94 | text | body_candidate_excluded | after_back_matter_stop | after_back_matter_stop | after_stop | p6:body_region:1 | p6:front_matter:column_2_of_2:white | [255, 255, 255] white | [306.6, 243.76, 253.42, 81.37] | The Mn-rich and Ni-rich regions also affect the relative Raman intensities of the E g and A1 g modes. The E g /A1 g intensity ratio is consistently lower in the Ni-enriched regions (S1) than in the Mn-enriched regions (S2). Specifically, E g /A1 g in S1 is 0.49, 0.58, and 0.48 for L-NM 26, L-NM 35, and L-NM 44, respectively, whereas the corresponding values in S2 are 0.77, 0.59, and 0.72. This trend indicates that higher local Ni content (and lower Mn content) reduces the relative E g intensity, while Mn-rich regions exhibit a stronger E g contribution. | The Mn-rich and Ni-rich regions also affect the relative Raman intensities of the E g and A1 g modes. The E g /A1 g intensity ratio is consistently lower in the Ni-enriched regions (S1) than in the Mn-enriched regions (S2). Specifically, E g /A1 g in S1 is 0.49, 0.58, and 0.48 for L-NM 26, L-NM 35, and L-NM 44, respectively, whereas the corresponding values in S2 are 0.77, 0.59, and 0.72. This trend indicates that higher local Ni content (and lower Mn content) reduces the relative E g intensity, while Mn-rich regions exhibit a stronger E g contribution. | |
| medium | 6 | 95 | text | body_candidate_excluded | after_back_matter_stop | after_back_matter_stop | after_stop | p6:body_region:1 | p6:front_matter:column_2_of_2:white | [255, 255, 255] white | [306.6, 327.5, 253.42, 132.83] | A systematic shift of the A1 g band toward higher wavenumber is observed as the Ni/Mn ratio increases from 0.33 to 1.0 (Fig. 4), and the effect is most pronounced for the Ni-rich spectrum (S1). This behavior is consistent with progressive Ni enrichment of the rhombohedral component as Ni/Mn increases, accompanied by redistribution of Mn toward the monoclinic component. In a simplified vibrational picture, Raman frequency depends on the bond force constant and reduced mass; stronger M O bonding (e.g., associated with higher Ni valence and increased bond polarization) can shift the A1 g mode to higher wavenumber. Accordingly, the A1 g feature in Ni-rich regions shifts from ~597 to ~647 cm 1 as Ni/Mn increases from 0.33 to 1.0 (Fig. 4). All samples retain the characteristic broad E g and A1 g bands of layered oxides (Fig. 4). | A systematic shift of the A1 g band toward higher wavenumber is observed as the Ni/Mn ratio increases from 0.33 to 1.0 (Fig. 4), and the effect is most pronounced for the Ni-rich spectrum (S1). This behavior is consistent with progressive Ni enrichment of the rhombohedral component as Ni/Mn increases, accompanied by redistribution of Mn toward the monoclinic component. In a simplified vibrational picture, Raman frequency depends on the bond force constant and reduced mass; stronger M O bonding (e.g., associated with higher Ni valence and increased bond polarization) can shift the A1 g mode to higher wavenumber. Accordingly, the A1 g feature in Ni-rich regions shifts from ~597 to ~647 cm 1 as Ni/Mn increases from 0.33 to 1.0 (Fig. 4). All samples retain the characteristic broad E g and A1 g bands of layered oxides (Fig. 4). | |
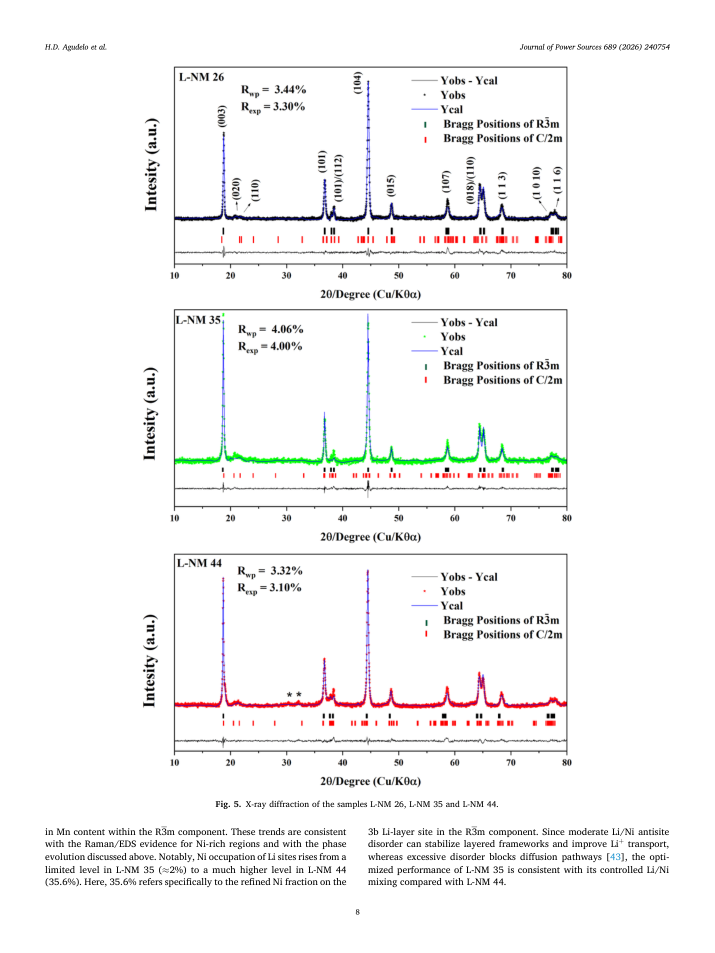
| medium | 6 | 96 | text | body_candidate_excluded | after_back_matter_stop | after_back_matter_stop | after_stop | p6:body_region:1 | p6:body_zone:column_2_of_2:white | [255, 255, 255] white | [306.6, 463.45, 253.42, 165.32] | Fig. 5 shows the XRD patterns of L-NM 26, L-NM 35, and L-NM 44. Phase identification and Rietveld refinement were performed using HighScore Plus and FullProf, respectively. The diffraction patterns are well described by a two-phase model comprising a rhombohedral layered phase (R3m, COD 1520787) and a monoclinic Li2MnO3-like phase (C2/m, COD 1514067), while L-NM 44 requires an additional minor Li2CO3 impurity phase. Across the series, increasing the Ni/Mn ratio changes both the R3m/C2/m phase balance and the impurity tendency: L-NM 35 preserves a dominant rhombohedral contribution with controlled monoclinic participation, whereas L-NM 44 shifts toward a larger monoclinic fraction and shows additional carbonate/ hydroxide-related reflections. Weak reflections in the 2 θ = 20 -25 ◦ range indexed to (020)/(110) are consistent with the monoclinic component. The clear splitting of (006)/(102) at 37.64 ◦ /37.91 ◦ and (018)/(110) at 64.47 ◦ /65.07 ◦ confirms the formation of a well-layered hexagonal framework. | Fig. 5 shows the XRD patterns of L-NM 26, L-NM 35, and L-NM 44. Phase identification and Rietveld refinement were performed using HighScore Plus and FullProf, respectively. The diffraction patterns are well described by a two-phase model comprising a rhombohedral layered phase (R3m, COD 1520787) and a monoclinic Li2MnO3-like phase (C2/m, COD 1514067), while L-NM 44 requires an additional minor Li2CO3 impurity phase. Across the series, increasing the Ni/Mn ratio changes both the R3m/C2/m phase balance and the impurity tendency: L-NM 35 preserves a dominant rhombohedral contribution with controlled monoclinic participation, whereas L-NM 44 shifts toward a larger monoclinic fraction and shows additional carbonate/ hydroxide-related reflections. Weak reflections in the 2 θ = 20 -25 ◦ range indexed to (020)/(110) are consistent with the monoclinic component. The clear splitting of (006)/(102) at 37.64 ◦ /37.91 ◦ and (018)/(110) at 64.47 ◦ /65.07 ◦ confirms the formation of a well-layered hexagonal framework. | |
| medium | 6 | 97 | text | body_candidate_excluded | after_back_matter_stop | after_back_matter_stop | after_stop | p6:body_region:1 | p6:bottom_margin:column_2_of_2:white | [255, 255, 255] white | [306.6, 631.94, 253.42, 101.42] | Cation mixing was assessed using the I(003)/I(104) intensity ratio, which is 0.59 (L-NM 26), 1.05 (L-NM 35), and 0.87 (L-NM 44). Since higher I(003)/I(104) values (typically > 1.2) indicate lower Li/Ni disorder, these results suggest moderate cation mixing in all samples, with the lowest disorder for L-NM 35 [45,46]. In L-NM 44, weak additional peaks at 30.5 ◦ and 32.17 ◦ are assigned to Li2CO3 and LiOH, respectively [47], consistent with FTIR evidence of enhanced carbonate-related bands at higher Ni/Mn ratio and with higher BET surface area (greater exposure to air). Finally, crystallite sizes estimated from the FWHM of the (104) reflection are 30.4, 28.1, and 27.8 nm for L-NM 26, L-NM 35, and L-NM | Cation mixing was assessed using the I(003)/I(104) intensity ratio, which is 0.59 (L-NM 26), 1.05 (L-NM 35), and 0.87 (L-NM 44). Since higher I(003)/I(104) values (typically > 1.2) indicate lower Li/Ni disorder, these results suggest moderate cation mixing in all samples, with the lowest disorder for L-NM 35 [45,46]. In L-NM 44, weak additional peaks at 30.5 ◦ and 32.17 ◦ are assigned to Li2CO3 and LiOH, respectively [47], consistent with FTIR evidence of enhanced carbonate-related bands at higher Ni/Mn ratio and with higher BET surface area (greater exposure to air). Finally, crystallite sizes estimated from the FWHM of the (104) reflection are 30.4, 28.1, and 27.8 nm for L-NM 26, L-NM 35, and L-NM | |
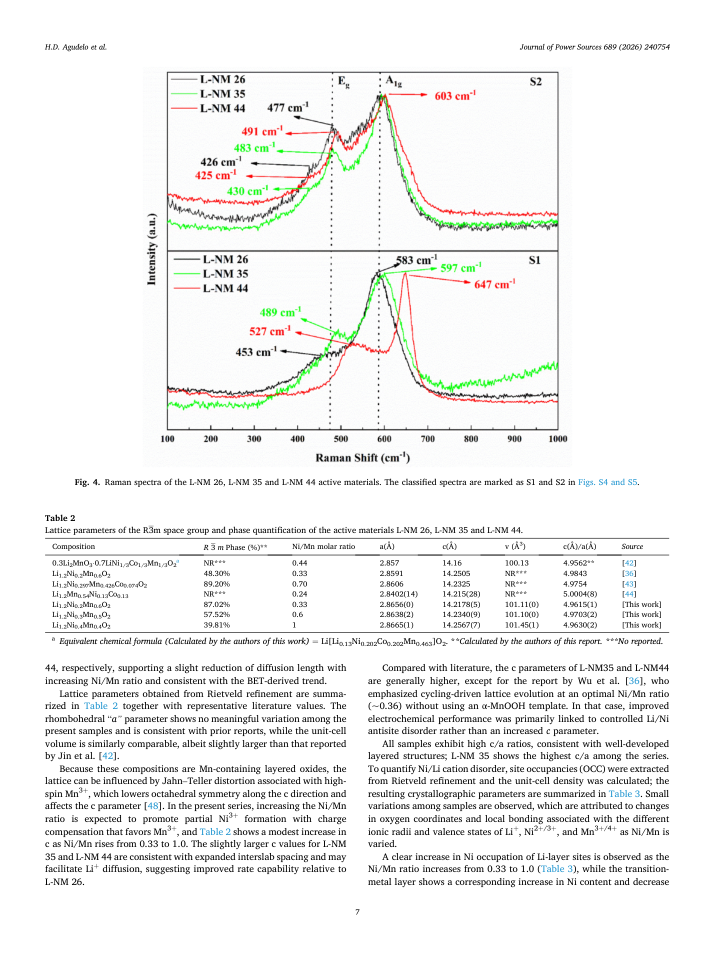
| medium | 7 | 105 | text | body_candidate_excluded | after_back_matter_stop | after_back_matter_stop | after_stop | p7:body_region:0 | p7:page_body:column_1_of_2:white | [255, 255, 255] white | [37.59, 575.07, 253.43, 59.58] | Lattice parameters obtained from Rietveld refinement are summarized in Table 2 together with representative literature values. The rhombohedral ' a ' parameter shows no meaningful variation among the present samples and is consistent with prior reports, while the unit-cell volume is similarly comparable, albeit slightly larger than that reported by Jin et al. [42]. | Lattice parameters obtained from Rietveld refinement are summarized in Table 2 together with representative literature values. The rhombohedral ' a ' parameter shows no meaningful variation among the present samples and is consistent with prior reports, while the unit-cell volume is similarly comparable, albeit slightly larger than that reported by Jin et al. [42]. | |
| medium | 7 | 106 | text | body_candidate_excluded | after_back_matter_stop | after_back_matter_stop | after_stop | p7:body_region:0 | p7:bottom_margin:column_1_of_2:white | [255, 255, 255] white | [37.59, 637.83, 253.44, 101.42] | Because these compositions are Mn-containing layered oxides, the lattice can be influenced by Jahn -Teller distortion associated with highspin Mn 3 + , which lowers octahedral symmetry along the c direction and affects the c parameter [48]. In the present series, increasing the Ni/Mn ratio is expected to promote partial Ni 3 + formation with charge compensation that favors Mn 3 + , and Table 2 shows a modest increase in c as Ni/Mn rises from 0.33 to 1.0. The slightly larger c values for L-NM 35 and L-NM 44 are consistent with expanded interslab spacing and may facilitate Li + diffusion, suggesting improved rate capability relative to L-NM 26. | Because these compositions are Mn-containing layered oxides, the lattice can be influenced by Jahn -Teller distortion associated with highspin Mn 3 + , which lowers octahedral symmetry along the c direction and affects the c parameter [48]. In the present series, increasing the Ni/Mn ratio is expected to promote partial Ni 3 + formation with charge compensation that favors Mn 3 + , and Table 2 shows a modest increase in c as Ni/Mn rises from 0.33 to 1.0. The slightly larger c values for L-NM 35 and L-NM 44 are consistent with expanded interslab spacing and may facilitate Li + diffusion, suggesting improved rate capability relative to L-NM 26. | |
| medium | 7 | 107 | text | body_candidate_excluded | after_back_matter_stop | after_back_matter_stop | after_stop | p7:body_region:1 | p7:page_body:column_2_of_2:white | [255, 255, 255] white | [306.59, 554.1, 253.41, 59.64] | Compared with literature, the c parameters of L-NM35 and L-NM44 are generally higher, except for the report by Wu et al. [36], who emphasized cycling-driven lattice evolution at an optimal Ni/Mn ratio (~0.36) without using an α -MnOOH template. In that case, improved electrochemical performance was primarily linked to controlled Li/Ni antisite disorder rather than an increased c parameter. | Compared with literature, the c parameters of L-NM35 and L-NM44 are generally higher, except for the report by Wu et al. [36], who emphasized cycling-driven lattice evolution at an optimal Ni/Mn ratio (~0.36) without using an α -MnOOH template. In that case, improved electrochemical performance was primarily linked to controlled Li/Ni antisite disorder rather than an increased c parameter. | |
| medium | 7 | 108 | text | body_candidate_excluded | after_back_matter_stop | after_back_matter_stop | after_stop | p7:body_region:1 | p7:page_body:column_2_of_2:white | [255, 255, 255] white | [306.6, 616.91, 253.41, 90.99] | All samples exhibit high c/a ratios, consistent with well-developed layered structures; L-NM 35 shows the highest c/a among the series. To quantify Ni/Li cation disorder, site occupancies (OCC) were extracted from Rietveld refinement and the unit-cell density was calculated; the resulting crystallographic parameters are summarized in Table 3. Small variations among samples are observed, which are attributed to changes in oxygen coordinates and local bonding associated with the different ionic radii and valence states of Li + , Ni 2 + /3 + , and Mn 3 + /4 + as Ni/Mn is varied. | All samples exhibit high c/a ratios, consistent with well-developed layered structures; L-NM 35 shows the highest c/a among the series. To quantify Ni/Li cation disorder, site occupancies (OCC) were extracted from Rietveld refinement and the unit-cell density was calculated; the resulting crystallographic parameters are summarized in Table 3. Small variations among samples are observed, which are attributed to changes in oxygen coordinates and local bonding associated with the different ionic radii and valence states of Li + , Ni 2 + /3 + , and Mn 3 + /4 + as Ni/Mn is varied. | |
| medium | 7 | 109 | text | affiliation | after_back_matter_stop | after_back_matter_stop | after_stop | p7:body_region:1 | p7:bottom_margin:column_2_of_2:white | [255, 255, 255] white | [306.6, 711.02, 253.42, 28.23] | A clear increase in Ni occupation of Li-layer sites is observed as the Ni/Mn ratio increases from 0.33 to 1.0 (Table 3), while the transitionmetal layer shows a corresponding increase in Ni content and decrease | A clear increase in Ni occupation of Li-layer sites is observed as the Ni/Mn ratio increases from 0.33 to 1.0 (Table 3), while the transitionmetal layer shows a corresponding increase in Ni content and decrease | |
| medium | 8 | 113 | text | body_candidate_excluded | after_back_matter_stop | after_back_matter_stop | after_stop | p8:bottom_margin:column_1_of_2:white | [255, 255, 255] white | [37.59, 690.39, 253.44, 49.15] | in Mn content within the R3m component. These trends are consistent with the Raman/EDS evidence for Ni-rich regions and with the phase evolution discussed above. Notably, Ni occupation of Li sites rises from a limited level in L-NM 35 ( ≈ 2%) to a much higher level in L-NM 44 (35.6%). Here, 35.6% refers specifically to the refined Ni fraction on the | in Mn content within the R3m component. These trends are consistent with the Raman/EDS evidence for Ni-rich regions and with the phase evolution discussed above. Notably, Ni occupation of Li sites rises from a limited level in L-NM 35 ( ≈ 2%) to a much higher level in L-NM 44 (35.6%). Here, 35.6% refers specifically to the refined Ni fraction on the | ||
| medium | 8 | 115 | text | body_candidate_excluded | after_back_matter_stop | after_back_matter_stop | after_stop | p8:bottom_margin:column_2_of_2:white | [255, 255, 255] white | [306.59, 690.39, 253.42, 49.15] | 3b Li-layer site in the R3m component. Since moderate Li/Ni antisite disorder can stabilize layered frameworks and improve Li + transport, whereas excessive disorder blocks diffusion pathways [43], the optimized performance of L-NM 35 is consistent with its controlled Li/Ni mixing compared with L-NM 44. | 3b Li-layer site in the R3m component. Since moderate Li/Ni antisite disorder can stabilize layered frameworks and improve Li + transport, whereas excessive disorder blocks diffusion pathways [43], the optimized performance of L-NM 35 is consistent with its controlled Li/Ni mixing compared with L-NM 44. | ||
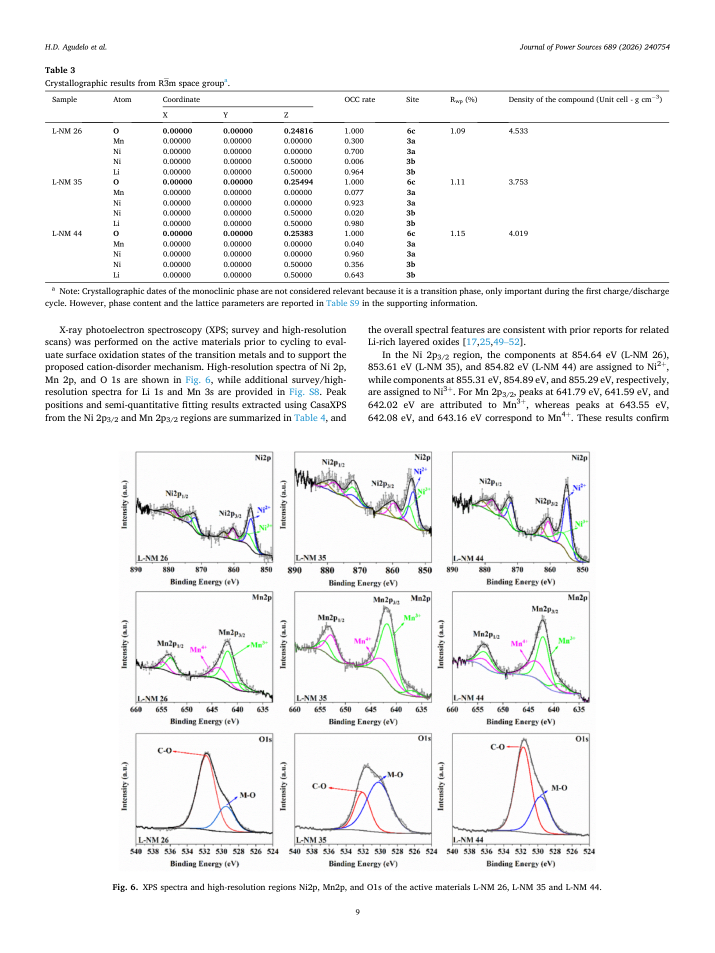
| medium | 9 | 121 | text | body_candidate_excluded | after_back_matter_stop | after_back_matter_stop | after_stop | p9:page_body:column_1_of_2:white | [255, 255, 255] white | [37.59, 271.82, 253.43, 80.56] | X-ray photoelectron spectroscopy (XPS; survey and high-resolution scans) was performed on the active materials prior to cycling to evaluate surface oxidation states of the transition metals and to support the proposed cation-disorder mechanism. High-resolution spectra of Ni 2p, Mn 2p, and O 1s are shown in Fig. 6, while additional survey/highresolution spectra for Li 1s and Mn 3s are provided in Fig. S8. Peak positions and semi-quantitative fitting results extracted using CasaXPS from the Ni 2p3/2 and Mn 2p3/2 regions are summarized in Table 4, and | X-ray photoelectron spectroscopy (XPS; survey and high-resolution scans) was performed on the active materials prior to cycling to evaluate surface oxidation states of the transition metals and to support the proposed cation-disorder mechanism. High-resolution spectra of Ni 2p, Mn 2p, and O 1s are shown in Fig. 6, while additional survey/highresolution spectra for Li 1s and Mn 3s are provided in Fig. S8. Peak positions and semi-quantitative fitting results extracted using CasaXPS from the Ni 2p3/2 and Mn 2p3/2 regions are summarized in Table 4, and | ||
| medium | 9 | 123 | text | body_candidate_excluded | after_back_matter_stop | after_back_matter_stop | after_stop | p9:page_body:column_2_of_2:white | [255, 255, 255] white | [306.59, 271.83, 253.38, 17.8] | the overall spectral features are consistent with prior reports for related Li-rich layered oxides [17,25,49 -52]. | the overall spectral features are consistent with prior reports for related Li-rich layered oxides [17,25,49 -52]. | ||
| medium | 9 | 124 | text | body_candidate_excluded | after_back_matter_stop | after_back_matter_stop | after_stop | p9:page_body:column_2_of_2:white | [255, 255, 255] white | [306.6, 292.8, 253.43, 59.58] | In the Ni 2p3/2 region, the components at 854.64 eV (L-NM 26), 853.61 eV (L-NM 35), and 854.82 eV (L-NM 44) are assigned to Ni 2 + , while components at 855.31 eV, 854.89 eV, and 855.29 eV, respectively, are assigned to Ni 3 + . For Mn 2p3/2, peaks at 641.79 eV, 641.59 eV, and 642.02 eV are attributed to Mn 3 + , whereas peaks at 643.55 eV, 642.08 eV, and 643.16 eV correspond to Mn 4 + . These results confirm | In the Ni 2p3/2 region, the components at 854.64 eV (L-NM 26), 853.61 eV (L-NM 35), and 854.82 eV (L-NM 44) are assigned to Ni 2 + , while components at 855.31 eV, 854.89 eV, and 855.29 eV, respectively, are assigned to Ni 3 + . For Mn 2p3/2, peaks at 641.79 eV, 641.59 eV, and 642.02 eV are attributed to Mn 3 + , whereas peaks at 643.55 eV, 642.08 eV, and 643.16 eV correspond to Mn 4 + . These results confirm | ||
| medium | 10 | 131 | text | body_candidate_excluded | after_back_matter_stop | after_back_matter_stop | after_stop | p10:body_region:0 | p10:body_zone:column_1_of_2:white | [255, 255, 255] white | [37.59, 359.24, 253.44, 195.59] | Although XPS does not provide crystallographic site specificity, the combined XPS redox trends and the phase fractions/occupancies obtained from XRD Rietveld refinement support our structural model. At higher Ni/Mn ratio, where the monoclinic fraction increases (XRD refinement), the surface shows a higher Ni 2 + contribution; quantitatively, the Ni 2 + fraction increases by 6.11% when Ni/Mn changes from 0.6 to 1.0 (Table 4). This behavior is consistent with the chargecompensation requirements of the Rietveld-derived occupancy model (Table 3), in which increasing Ni/Mn is accompanied by increased cation disorder (including Ni involvement in the Li layer) and an increased Mn 3 + /Mn 4 + contribution in Mn-rich monoclinic domains. The presence of stacking-fault features observed by HRTEM for L-NM 35 and L-NM 44 (Fig. 3) further supports the emergence of locally disordered environments at higher Ni/Mn ratio. The coexistence of a larger Ni 3 + contribution with residual Ni 2 + , especially when the Ni/Mn ratio increases from 0.60 to 1.00, suggests redox-state redistribution; the residual Ni 2 + species are the most likely Ni species to participate in Li-site occupation because their ionic radius is close to that of Li + , consistent with the stacking-fault features observed in monoclinic-related domains. | Although XPS does not provide crystallographic site specificity, the combined XPS redox trends and the phase fractions/occupancies obtained from XRD Rietveld refinement support our structural model. At higher Ni/Mn ratio, where the monoclinic fraction increases (XRD refinement), the surface shows a higher Ni 2 + contribution; quantitatively, the Ni 2 + fraction increases by 6.11% when Ni/Mn changes from 0.6 to 1.0 (Table 4). This behavior is consistent with the chargecompensation requirements of the Rietveld-derived occupancy model (Table 3), in which increasing Ni/Mn is accompanied by increased cation disorder (including Ni involvement in the Li layer) and an increased Mn 3 + /Mn 4 + contribution in Mn-rich monoclinic domains. The presence of stacking-fault features observed by HRTEM for L-NM 35 and L-NM 44 (Fig. 3) further supports the emergence of locally disordered environments at higher Ni/Mn ratio. The coexistence of a larger Ni 3 + contribution with residual Ni 2 + , especially when the Ni/Mn ratio increases from 0.60 to 1.00, suggests redox-state redistribution; the residual Ni 2 + species are the most likely Ni species to participate in Li-site occupation because their ionic radius is close to that of Li + , consistent with the stacking-fault features observed in monoclinic-related domains. | |
| medium | 10 | 132 | text | body_candidate_excluded | after_back_matter_stop | after_back_matter_stop | after_stop | p10:body_region:0 | p10:body_zone:column_1_of_2:white | [255, 255, 255] white | [37.59, 558.01, 253.43, 111.91] | Δ eV of the binding energies in the Mn3s core level is frequently used to determine the coexistence of the Mn 3 + and Mn 4 + [53]. It can also be considered that the increasing Δ eV is due to the reduction of Mn from + 4 to 2 + . Thus, the Δ eV commonly reported for Mn 4 + is between 4.5 eV and 4.7 eV, for Mn 3 + is above ~5.2 eV and for Mn 2 + nearly to ~6.0 eV [13,51,53 -55]. For the current work, it is noted that when the Ni/Mn molar ratio passed from 0.33 to 1, the Δ eV seemed to increase (Table 4 and Fig. S8). This result confirmed that the Δ eV is forced to be wider when the Ni/Mn molar ratio passes from 0.33 to 1. Therefore, the Mn 3 + species are forced to appear. Also, the Mn 2 + was not seen because the corresponding satellite was not observed. | Δ eV of the binding energies in the Mn3s core level is frequently used to determine the coexistence of the Mn 3 + and Mn 4 + [53]. It can also be considered that the increasing Δ eV is due to the reduction of Mn from + 4 to 2 + . Thus, the Δ eV commonly reported for Mn 4 + is between 4.5 eV and 4.7 eV, for Mn 3 + is above ~5.2 eV and for Mn 2 + nearly to ~6.0 eV [13,51,53 -55]. For the current work, it is noted that when the Ni/Mn molar ratio passed from 0.33 to 1, the Δ eV seemed to increase (Table 4 and Fig. S8). This result confirmed that the Δ eV is forced to be wider when the Ni/Mn molar ratio passes from 0.33 to 1. Therefore, the Mn 3 + species are forced to appear. Also, the Mn 2 + was not seen because the corresponding satellite was not observed. | |
| medium | 10 | 133 | text | body_candidate_excluded | after_back_matter_stop | after_back_matter_stop | after_stop | p10:body_region:0 | p10:bottom_margin:column_1_of_2:white | [255, 255, 255] white | [37.59, 673.04, 253.44, 70.07] | According to the core-level Li1s, all samples showed a centered peak at ~54.5 eV corresponding to Li-O in the tetrahedral arrangement and a centered peak at ~49.5 eV corresponding to Mn-O in the octahedral arrangement (Fig. S8) [13,56]. Additionally, the high-resolution O1s region exhibited peaks in the range of ~530 eV to ~532 eV, corresponding to M O (metal-oxygen) and C -O bonds, respectively [13,56]. The peak intensity related to C-O showed the significant presence of | According to the core-level Li1s, all samples showed a centered peak at ~54.5 eV corresponding to Li-O in the tetrahedral arrangement and a centered peak at ~49.5 eV corresponding to Mn-O in the octahedral arrangement (Fig. S8) [13,56]. Additionally, the high-resolution O1s region exhibited peaks in the range of ~530 eV to ~532 eV, corresponding to M O (metal-oxygen) and C -O bonds, respectively [13,56]. The peak intensity related to C-O showed the significant presence of | |
| medium | 10 | 134 | text | body_candidate_excluded | after_back_matter_stop | after_back_matter_stop | after_stop | p10:body_region:1 | p10:top_margin:column_2_of_2:white | [255, 255, 255] white | [306.59, 55.48, 253.43, 59.64] | Li2CO3 in the surface of the L-NM 44 active material, and the higher intensity of the M O (M = Metal) also clarified the significant oxygen integration of the L-NM 35 active material. Raman and XPS results are used as indirect evidence of changes in local M O bonding and the surface oxygen environment, rather than as direct measurements of M O bond lengths, bond energies, or operando oxygen activity. | Li2CO3 in the surface of the L-NM 44 active material, and the higher intensity of the M O (M = Metal) also clarified the significant oxygen integration of the L-NM 35 active material. Raman and XPS results are used as indirect evidence of changes in local M O bonding and the surface oxygen environment, rather than as direct measurements of M O bond lengths, bond energies, or operando oxygen activity. | |
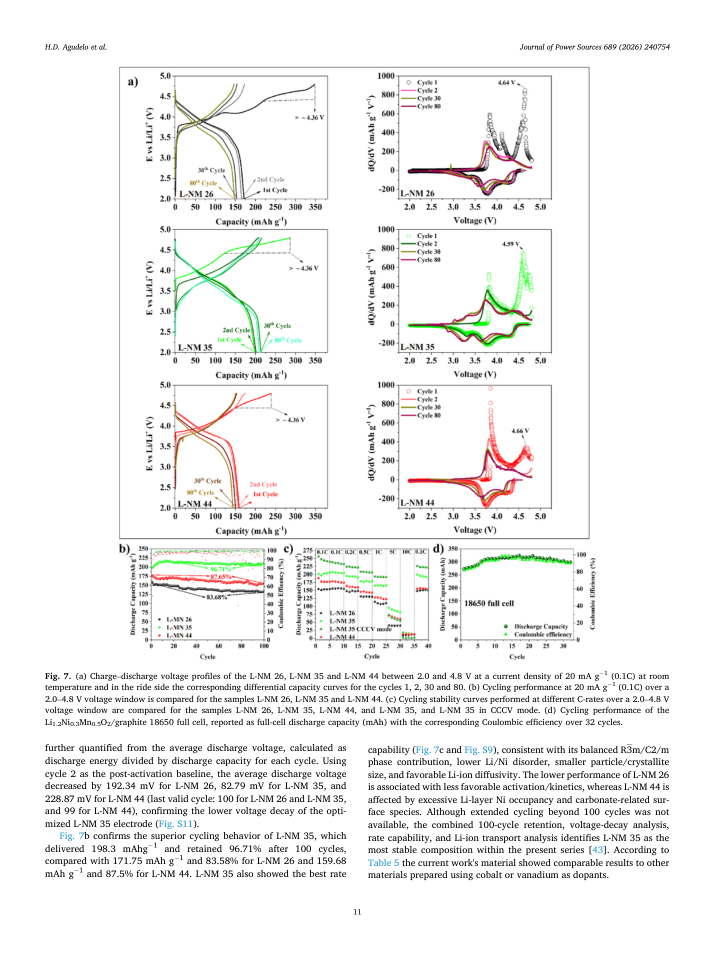
| medium | 10 | 136 | text | body_candidate_excluded | after_back_matter_stop | after_back_matter_stop | after_stop | p10:body_region:1 | p10:body_zone:column_2_of_2:white | [255, 255, 255] white | [306.6, 150.27, 253.44, 258.35] | The left side of Fig. 7a shows each sample's initial charge/discharge profiles performed at 20 mA g 1 (1C = 200 mA g 1 ) with different Ni/ Mn molar ratios. The initial discharge capacities during the first cycle were 171.75, 198.3 and 159.68 mAh g 1 , along with coulombic efficiencies of 49.33, 69.37, and 66.93% for the active materials L-NM 26, L-NM 35 and L-NM 44 respectively. All samples contain at least three plateaus in the first charge curves under two electrochemical processes (see the left side of Fig. 7a and the corresponding dQ/dV plot). The first plateau at ~3.8 V is due to the de-intercalation of Li + from LiMO2 (M = Mn, Ni), owing to the oxidation of Ni from 2 + to 3 + . The second plateau at ~4.2 V is due to the oxidation of Ni 3 + to N 4 + . The third plateau, observed within the voltage range of 4.4 V to 4.8 V, is typically associated with the irreversible removal of Li2O from Li2MnO3 [25]. The L-NM 35 sample exhibited greater extra capacity, attributed to the monoclinic phase, which, as reported in the literature, is associated with oxygen release [8]. When this process is finished, a new phase is formed. The monoclinic phase transitioned to a cubic spinel-like phase framework [13]. The XRD analysis showed that sample L-NM 35 contained a more reasonable monoclinic phase amount than the rest of the active materials, and it should be expected to have a more considerable charging capacity in the voltage plateaus between 4.4 V and 4.8 V. However, all samples exhibited a considerable charge capacity. On the other hand, all reduction peaks observed in the discharge capacity curve correspond to the sequential reduction of Ni 4 + /Ni 3 + /Ni 2 + vs. Li/Li + (~4.3 V and ~3.7 V) and Mn 4 + /Mn 3 + vs. Li/Li + (~3.2 V region) [25]. | The left side of Fig. 7a shows each sample's initial charge/discharge profiles performed at 20 mA g 1 (1C = 200 mA g 1 ) with different Ni/ Mn molar ratios. The initial discharge capacities during the first cycle were 171.75, 198.3 and 159.68 mAh g 1 , along with coulombic efficiencies of 49.33, 69.37, and 66.93% for the active materials L-NM 26, L-NM 35 and L-NM 44 respectively. All samples contain at least three plateaus in the first charge curves under two electrochemical processes (see the left side of Fig. 7a and the corresponding dQ/dV plot). The first plateau at ~3.8 V is due to the de-intercalation of Li + from LiMO2 (M = Mn, Ni), owing to the oxidation of Ni from 2 + to 3 + . The second plateau at ~4.2 V is due to the oxidation of Ni 3 + to N 4 + . The third plateau, observed within the voltage range of 4.4 V to 4.8 V, is typically associated with the irreversible removal of Li2O from Li2MnO3 [25]. The L-NM 35 sample exhibited greater extra capacity, attributed to the monoclinic phase, which, as reported in the literature, is associated with oxygen release [8]. When this process is finished, a new phase is formed. The monoclinic phase transitioned to a cubic spinel-like phase framework [13]. The XRD analysis showed that sample L-NM 35 contained a more reasonable monoclinic phase amount than the rest of the active materials, and it should be expected to have a more considerable charging capacity in the voltage plateaus between 4.4 V and 4.8 V. However, all samples exhibited a considerable charge capacity. On the other hand, all reduction peaks observed in the discharge capacity curve correspond to the sequential reduction of Ni 4 + /Ni 3 + /Ni 2 + vs. Li/Li + (~4.3 V and ~3.7 V) and Mn 4 + /Mn 3 + vs. Li/Li + (~3.2 V region) [25]. | |
| medium | 10 | 137 | text | body_candidate_excluded | after_back_matter_stop | after_back_matter_stop | after_stop | p10:body_region:1 | p10:body_zone:column_2_of_2:white | [255, 255, 255] white | [306.6, 411.8, 253.43, 132.83] | According to the report of H. Yu and Zhou, for their Li-rich composition study (Li1.2 Ni0.166Mn0.567Co0.067O2), there is an arising of cubic spinel-like phase framework that can be confirmed by the appeared oxidation peaks assigned to the pair redox Mn 3 + /Mn 4 + between 3.0V and 3.2V after the first cycle [8]. This same phenomenon was seen in this work for all samples, even after cycle 80th (see the corresponding dQ/dV plot of Fig. 7a). The sample L-NM 35 showed broader peaks between 3.0V and 3.2V as well as the peaks at ~3.8V and ~4.2V for the cycles 30 and 80, suggesting more gradual cubic spinel phase transformation compared to the sharp peaks of the samples L-NM 26 and L-NM 44. Also, these results suggest a more significant electrochemical active region presence of Ni 3 + and the considerable presence of Mn 3 + in the sample L-NM 35 during cycling. | According to the report of H. Yu and Zhou, for their Li-rich composition study (Li1.2 Ni0.166Mn0.567Co0.067O2), there is an arising of cubic spinel-like phase framework that can be confirmed by the appeared oxidation peaks assigned to the pair redox Mn 3 + /Mn 4 + between 3.0V and 3.2V after the first cycle [8]. This same phenomenon was seen in this work for all samples, even after cycle 80th (see the corresponding dQ/dV plot of Fig. 7a). The sample L-NM 35 showed broader peaks between 3.0V and 3.2V as well as the peaks at ~3.8V and ~4.2V for the cycles 30 and 80, suggesting more gradual cubic spinel phase transformation compared to the sharp peaks of the samples L-NM 26 and L-NM 44. Also, these results suggest a more significant electrochemical active region presence of Ni 3 + and the considerable presence of Mn 3 + in the sample L-NM 35 during cycling. | |
| medium | 10 | 138 | text | body_candidate_excluded | after_back_matter_stop | after_back_matter_stop | after_stop | p10:body_region:1 | p10:body_zone:column_2_of_2:white | [255, 255, 255] white | [306.6, 547.8, 253.4, 90.99] | Activation of the Li2MnO3-like component during the first charge is associated with lithium/oxygen loss or oxygen redox and subsequent spinel-like structural rearrangement. The first-cycle coulombic efficiencies were 49.33%, 69.37%, and 66.93% for L-NM 26, L-NM 35, and L-NM 44, respectively. Although L-NM 44 contains the largest monoclinic fraction, its first discharge capacity is limited by higher Li/Ni disorder and the Li2CO3-rich surface layer observed by HRTEM/XRD (Fig. S6), which can hinder Li-ion diffusion and reduce the accessible anionic-redox contribution [13,57]. | Activation of the Li2MnO3-like component during the first charge is associated with lithium/oxygen loss or oxygen redox and subsequent spinel-like structural rearrangement. The first-cycle coulombic efficiencies were 49.33%, 69.37%, and 66.93% for L-NM 26, L-NM 35, and L-NM 44, respectively. Although L-NM 44 contains the largest monoclinic fraction, its first discharge capacity is limited by higher Li/Ni disorder and the Li2CO3-rich surface layer observed by HRTEM/XRD (Fig. S6), which can hinder Li-ion diffusion and reduce the accessible anionic-redox contribution [13,57]. | |
| medium | 10 | 139 | text | body_candidate_excluded | after_back_matter_stop | after_back_matter_stop | after_stop | p10:body_region:1 | p10:bottom_margin:column_2_of_2:white | [255, 255, 255] white | [306.6, 641.91, 253.43, 101.48] | Furthermore, concerning the Ni/Mn molar ratio, the oxidation peak intensities at 3.6V and 4.6V appeared to shift as the Ni/Mn ratio increased from 0.33 to 1, aligning with the findings from the XRD analysis. These dQ/dV changes indicate that the structural differences identified by XRD/Rietveld and HRTEM are electrochemically reflected in the activation and cycling response: L-NM 35 shows broader and more stable redox features, consistent with a balanced monoclinic/rhombohedral contribution and controlled Li/Ni disorder, whereas the sharper/ shifted features of L-NM 26 and L-NM 44 indicate greater polarization and less favorable structural evolution. Voltage-fade behavior was | Furthermore, concerning the Ni/Mn molar ratio, the oxidation peak intensities at 3.6V and 4.6V appeared to shift as the Ni/Mn ratio increased from 0.33 to 1, aligning with the findings from the XRD analysis. These dQ/dV changes indicate that the structural differences identified by XRD/Rietveld and HRTEM are electrochemically reflected in the activation and cycling response: L-NM 35 shows broader and more stable redox features, consistent with a balanced monoclinic/rhombohedral contribution and controlled Li/Ni disorder, whereas the sharper/ shifted features of L-NM 26 and L-NM 44 indicate greater polarization and less favorable structural evolution. Voltage-fade behavior was | |
| medium | 11 | 144 | text | body_candidate_excluded | after_back_matter_stop | after_back_matter_stop | after_stop | p11:body_region:0 | p11:page_body:column_1_of_2:white | [255, 255, 255] white | [37.59, 620.83, 253.43, 70.13] | further quantified from the average discharge voltage, calculated as discharge energy divided by discharge capacity for each cycle. Using cycle 2 as the post-activation baseline, the average discharge voltage decreased by 192.34 mV for L-NM 26, 82.79 mV for L-NM 35, and 228.87 mV for L-NM 44 (last valid cycle: 100 for L-NM 26 and L-NM 35, and 99 for L-NM 44), confirming the lower voltage decay of the optimized L-NM 35 electrode (Fig. S11). | further quantified from the average discharge voltage, calculated as discharge energy divided by discharge capacity for each cycle. Using cycle 2 as the post-activation baseline, the average discharge voltage decreased by 192.34 mV for L-NM 26, 82.79 mV for L-NM 35, and 228.87 mV for L-NM 44 (last valid cycle: 100 for L-NM 26 and L-NM 35, and 99 for L-NM 44), confirming the lower voltage decay of the optimized L-NM 35 electrode (Fig. S11). | |
| medium | 11 | 145 | text | body_candidate_excluded | after_back_matter_stop | after_back_matter_stop | after_stop | p11:body_region:0 | p11:bottom_margin:column_1_of_2:white | [255, 255, 255] white | [37.59, 694.07, 253.44, 38.72] | Fig. 7b confirms the superior cycling behavior of L-NM 35, which delivered 198.3 mAhg 1 and retained 96.71% after 100 cycles, compared with 171.75 mAh g 1 and 83.58% for L-NM 26 and 159.68 mAh g 1 and 87.5% for L-NM 44. L-NM 35 also showed the best rate | Fig. 7b confirms the superior cycling behavior of L-NM 35, which delivered 198.3 mAhg 1 and retained 96.71% after 100 cycles, compared with 171.75 mAh g 1 and 83.58% for L-NM 26 and 159.68 mAh g 1 and 87.5% for L-NM 44. L-NM 35 also showed the best rate | |
| medium | 11 | 146 | text | body_candidate_excluded | after_back_matter_stop | after_back_matter_stop | after_stop | p11:body_region:1 | p11:bottom_margin:column_2_of_2:white | [255, 255, 255] white | [306.59, 621.96, 253.43, 111.91] | capability (Fig. 7c and Fig. S9), consistent with its balanced R3m/C2/m phase contribution, lower Li/Ni disorder, smaller particle/crystallite size, and favorable Li-ion diffusivity. The lower performance of L-NM 26 is associated with less favorable activation/kinetics, whereas L-NM 44 is affected by excessive Li-layer Ni occupancy and carbonate-related surface species. Although extended cycling beyond 100 cycles was not available, the combined 100-cycle retention, voltage-decay analysis, rate capability, and Li-ion transport analysis identifies L-NM 35 as the most stable composition within the present series [43]. According to Table 5 the current work's material showed comparable results to other materials prepared using cobalt or vanadium as dopants. | capability (Fig. 7c and Fig. S9), consistent with its balanced R3m/C2/m phase contribution, lower Li/Ni disorder, smaller particle/crystallite size, and favorable Li-ion diffusivity. The lower performance of L-NM 26 is associated with less favorable activation/kinetics, whereas L-NM 44 is affected by excessive Li-layer Ni occupancy and carbonate-related surface species. Although extended cycling beyond 100 cycles was not available, the combined 100-cycle retention, voltage-decay analysis, rate capability, and Li-ion transport analysis identifies L-NM 35 as the most stable composition within the present series [43]. According to Table 5 the current work's material showed comparable results to other materials prepared using cobalt or vanadium as dopants. | |
| medium | 12 | 156 | text | body_candidate_excluded | after_back_matter_stop | after_back_matter_stop | after_stop | p12:body_region:0 | p12:front_matter:column_1_of_2:white | [255, 255, 255] white | [37.59, 312.13, 253.44, 70.07] | Preliminary 18650 Li1.2Ni0.3Mn0.5O2/graphite full-cell cycling data are presented in Fig. 7d as proof-of-concept validation. The cell delivered 273.53 mAh in the first cycle, reached 323.99 mAh at cycle 17, and retained 298.62 mAh after 32 cycles, corresponding to 92.17% retention relative to the maximum capacity. These values are reported as full-cell capacities in mAh and are therefore not compared directly with the halfcell specific capacities. | Preliminary 18650 Li1.2Ni0.3Mn0.5O2/graphite full-cell cycling data are presented in Fig. 7d as proof-of-concept validation. The cell delivered 273.53 mAh in the first cycle, reached 323.99 mAh at cycle 17, and retained 298.62 mAh after 32 cycles, corresponding to 92.17% retention relative to the maximum capacity. These values are reported as full-cell capacities in mAh and are therefore not compared directly with the halfcell specific capacities. | |
| medium | 12 | 157 | text | body_candidate_excluded | after_back_matter_stop | after_back_matter_stop | after_stop | p12:body_region:0 | p12:front_matter:column_1_of_2:white | [255, 255, 255] white | [37.59, 385.38, 253.44, 258.35] | The lithium-ion diffusivity (DLi + ) was calculated using the Galvanostatic Intermittent Titration Technique (GITT) and Electrochemical Impedance Spectroscopy (EIS). GITT was applied for the first charge, and the DLi from GITT was calculated after 0.80 y Li in Li1.2NixMn0.8-xO2 to observe the lithium coefficient in the last quintile Li extracted capacity. The estimated values for DLi + from GITT are summarized in Fig. S10 as a function of the y Li in Li1.2NixMn0.8-xO2. The L-NM 35 electrode reveals DLi + values in the range from 1 × 10 12 to 1 × 10 14 cm 2 s 1 , which are higher than the rest of tested materials. These values are consistent with the observation of Kaewmala et al. for the first cycle, which can be found for the different chemical compositions and the occurred phase transition [58]. It is important to highlight that there was no depletion of the DLi + in the active materials tested. The higher Li-ion diffusion coefficient observed in the L-NM 35 active cathode material favors the fast-charging performance displayed by the L-NM 35 electrode at the different C-rates. This means that the architecture, initial crystal structure, balance phases, and adequate Ni/Mn molar ratio contribute together to promoting Li + diffusion and to the outstanding electrochemical performance of the L-NM 35 cathode material. According to Fig. S10, the DLi + for the sample L-NM 26 was slightly affected by the transition phase during the de-intercalation of Li, since notably variability of the DLi + was seen. The samples L-NM 35 and L-NM 44 showed more homogeneous Li + diffusion. Furthermore, the sample L-NM 35 showed good kinetic performance and the highest electrochemical reversibility. | The lithium-ion diffusivity (DLi + ) was calculated using the Galvanostatic Intermittent Titration Technique (GITT) and Electrochemical Impedance Spectroscopy (EIS). GITT was applied for the first charge, and the DLi from GITT was calculated after 0.80 y Li in Li1.2NixMn0.8-xO2 to observe the lithium coefficient in the last quintile Li extracted capacity. The estimated values for DLi + from GITT are summarized in Fig. S10 as a function of the y Li in Li1.2NixMn0.8-xO2. The L-NM 35 electrode reveals DLi + values in the range from 1 × 10 12 to 1 × 10 14 cm 2 s 1 , which are higher than the rest of tested materials. These values are consistent with the observation of Kaewmala et al. for the first cycle, which can be found for the different chemical compositions and the occurred phase transition [58]. It is important to highlight that there was no depletion of the DLi + in the active materials tested. The higher Li-ion diffusion coefficient observed in the L-NM 35 active cathode material favors the fast-charging performance displayed by the L-NM 35 electrode at the different C-rates. This means that the architecture, initial crystal structure, balance phases, and adequate Ni/Mn molar ratio contribute together to promoting Li + diffusion and to the outstanding electrochemical performance of the L-NM 35 cathode material. According to Fig. S10, the DLi + for the sample L-NM 26 was slightly affected by the transition phase during the de-intercalation of Li, since notably variability of the DLi + was seen. The samples L-NM 35 and L-NM 44 showed more homogeneous Li + diffusion. Furthermore, the sample L-NM 35 showed good kinetic performance and the highest electrochemical reversibility. | |
| medium | 12 | 158 | text | body_candidate_excluded | after_back_matter_stop | after_back_matter_stop | after_stop | p12:body_region:0 | p12:bottom_margin:column_1_of_2:white | [255, 255, 255] white | [37.59, 646.85, 253.45, 91.05] | Fig. 8 shows Nyquist and Bode plots collected after galvanostatic charging, together with the equivalent electrical circuit used for fitting. The spectra contain high- and intermediate-frequency contributions associated with the cathode/electrolyte interphase and charge-transfer processes, followed by a low-frequency diffusion response. The Li-ion diffusion coefficients estimated from EIS at 40% SOC in cycle 10 were 6.73 x 10 12 , 6.84 x 10 12 , and 6.67 x 10 12 cm 2 s 1 for L-NM 26, LNM 35, and L-NM 44, respectively; these close values indicate comparable EIS-derived Li-ion diffusion, with L-NM 35 showing a slightly | Fig. 8 shows Nyquist and Bode plots collected after galvanostatic charging, together with the equivalent electrical circuit used for fitting. The spectra contain high- and intermediate-frequency contributions associated with the cathode/electrolyte interphase and charge-transfer processes, followed by a low-frequency diffusion response. The Li-ion diffusion coefficients estimated from EIS at 40% SOC in cycle 10 were 6.73 x 10 12 , 6.84 x 10 12 , and 6.67 x 10 12 cm 2 s 1 for L-NM 26, LNM 35, and L-NM 44, respectively; these close values indicate comparable EIS-derived Li-ion diffusion, with L-NM 35 showing a slightly | |
| medium | 12 | 160 | text | body_candidate_excluded | after_back_matter_stop | after_back_matter_stop | after_stop | p12:body_region:1 | p12:front_matter:column_2_of_2:white | [255, 255, 255] white | [306.59, 322.57, 253.39, 49.21] | The BET results further indicate that pore volume does not vary monotonically with Ni/Mn ratio. Instead, L-NM 35 combines the smallest clustered-particle size, intermediate surface area, and favorable pore/connectivity characteristics, which helps explain its lower polarization and better high-rate behavior. | The BET results further indicate that pore volume does not vary monotonically with Ni/Mn ratio. Instead, L-NM 35 combines the smallest clustered-particle size, intermediate surface area, and favorable pore/connectivity characteristics, which helps explain its lower polarization and better high-rate behavior. | |
| medium | 12 | 161 | text | body_candidate_excluded | after_back_matter_stop | after_back_matter_stop | after_stop | p12:body_region:1 | p12:front_matter:column_2_of_2:white | [255, 255, 255] white | [306.59, 374.9, 253.42, 112.98] | The Nyquist/Bode plots in Fig. 8 are used to compare the impedance spectral features and fitted response of the three electrodes. Because the BET surface area differs significantly among samples, the fitted resistance parameters were also normalized by BET-derived surface area and are presented in Fig. S12. After surface-area normalization, the resistance parameters increase with Ni/Mn ratio, indicating larger interfacial/charge-transfer resistance for the relative Ni-richer structure. Accordingly, the optimized behavior of L-NM 35 is interpreted from the combined evidence of moderate Li/Ni disorder, favorable R3m/C2/m balance, smaller particle size, voltage retention, rate capability, and Liion transport rather than from the charge-transfer resistance alone. | The Nyquist/Bode plots in Fig. 8 are used to compare the impedance spectral features and fitted response of the three electrodes. Because the BET surface area differs significantly among samples, the fitted resistance parameters were also normalized by BET-derived surface area and are presented in Fig. S12. After surface-area normalization, the resistance parameters increase with Ni/Mn ratio, indicating larger interfacial/charge-transfer resistance for the relative Ni-richer structure. Accordingly, the optimized behavior of L-NM 35 is interpreted from the combined evidence of moderate Li/Ni disorder, favorable R3m/C2/m balance, smaller particle size, voltage retention, rate capability, and Liion transport rather than from the charge-transfer resistance alone. | |
| medium | 12 | 162 | text | body_candidate_excluded | after_back_matter_stop | after_back_matter_stop | after_stop | p12:body_region:1 | p12:front_matter:column_2_of_2:white | [255, 255, 255] white | [306.6, 491.06, 253.41, 164.24] | The structural and electrochemical evidence therefore converge on the same interpretation: insufficient monoclinic activation and less favorable kinetics limit L-NM 26, whereas excessive Ni content in L-NM 44 increases Li/Ni disorder and surface carbonate contribution. In contrast, L-NM 35 balances phase fraction, cation disorder, particle size, and diffusion behavior, giving the best lithium-ion mobility and cycling stability within the studied composition window. From the mechanistic point of view, it can be said that increasing the Ni/Mn ratio promotes partial Ni 3 + formation, with charge compensation favoring Mn 3 + (as evidenced by XPS). Structurally, XRD data demonstrates an expansion in the c-lattice parameter as the Ni/Mn ratio rises from 0.33 to 1.0. These slightly larger c values for L-NM 35 and L-NM 44 are consistent with an expanded interslab spacing that facilitates Li + diffusion, thereby improving rate capability. Concurrently, this composition induces a moderate antisite disorder, which stabilizes the layered framework and further enhances Li + transport pathways. | The structural and electrochemical evidence therefore converge on the same interpretation: insufficient monoclinic activation and less favorable kinetics limit L-NM 26, whereas excessive Ni content in L-NM 44 increases Li/Ni disorder and surface carbonate contribution. In contrast, L-NM 35 balances phase fraction, cation disorder, particle size, and diffusion behavior, giving the best lithium-ion mobility and cycling stability within the studied composition window. From the mechanistic point of view, it can be said that increasing the Ni/Mn ratio promotes partial Ni 3 + formation, with charge compensation favoring Mn 3 + (as evidenced by XPS). Structurally, XRD data demonstrates an expansion in the c-lattice parameter as the Ni/Mn ratio rises from 0.33 to 1.0. These slightly larger c values for L-NM 35 and L-NM 44 are consistent with an expanded interslab spacing that facilitates Li + diffusion, thereby improving rate capability. Concurrently, this composition induces a moderate antisite disorder, which stabilizes the layered framework and further enhances Li + transport pathways. | |
| medium | 12 | 164 | text | body_candidate_excluded | after_back_matter_stop | after_back_matter_stop | after_stop | p12:body_region:1 | p12:bottom_margin:column_2_of_2:white | [255, 255, 255] white | [306.6, 689.82, 253.43, 49.15] | A Co-free Li-rich layered cathode series was successfully synthesized by tuning the Ni/Mn molar ratio using an α -MnOOH sacrificial template. Among the investigated compositions, Li1.2Ni0.3Mn0.5O2 (Ni/Mn = 0.6) delivered the best overall electrochemical performance, exhibiting an initial discharge capacity of 213.8 mAh g 1 under constant-current (CC) | A Co-free Li-rich layered cathode series was successfully synthesized by tuning the Ni/Mn molar ratio using an α -MnOOH sacrificial template. Among the investigated compositions, Li1.2Ni0.3Mn0.5O2 (Ni/Mn = 0.6) delivered the best overall electrochemical performance, exhibiting an initial discharge capacity of 213.8 mAh g 1 under constant-current (CC) | |
| medium | 13 | 169 | text | body_candidate_excluded | after_back_matter_stop | after_back_matter_stop | after_stop | p13:body_region:0 | p13:page_body:column_1_of_2:white | [255, 255, 255] white | [37.59, 502.14, 253.45, 115.22] | operation and 256.05 mAh g 1 under constant-current/constant-voltage (CCCV) operation, together with > 96.71% capacity retention after 100 cycles at 20 mA g 1 . This improved performance is attributed to an optimized balance between the rhombohedral (R 3 m) and monoclinic (C2/m) components, controlled cation disorder, and a hierarchical microstructure consisting of clustered secondary particles assembled from smaller primary particles, which collectively promote Li + transport and cycling stability. Thus, the optimized Ni/Mn = 0.6 composition is presented as a practical electrochemical performance window for this α -MnOOH-template-derived Co-free Li-rich series, rather than as a universal optimum for all Li-rich layered oxides. | operation and 256.05 mAh g 1 under constant-current/constant-voltage (CCCV) operation, together with > 96.71% capacity retention after 100 cycles at 20 mA g 1 . This improved performance is attributed to an optimized balance between the rhombohedral (R 3 m) and monoclinic (C2/m) components, controlled cation disorder, and a hierarchical microstructure consisting of clustered secondary particles assembled from smaller primary particles, which collectively promote Li + transport and cycling stability. Thus, the optimized Ni/Mn = 0.6 composition is presented as a practical electrochemical performance window for this α -MnOOH-template-derived Co-free Li-rich series, rather than as a universal optimum for all Li-rich layered oxides. | |
| medium | 13 | 170 | text | body_candidate_excluded | after_back_matter_stop | after_back_matter_stop | after_stop | p13:body_region:0 | p13:page_body:column_1_of_2:white | [255, 255, 255] white | [37.59, 620.49, 253.41, 80.56] | Structural analysis indicates that increasing Ni/Mn enriches the rhombohedral component in Ni while redistributing Mn toward the monoclinic Li2MnO3-like domains, thereby modifying phase fraction and local bonding environments. These composition-dependent structural features, together with the particle-size evolution and porosity characteristics, highlight that C-rate capability is governed not only by diffusion length but also by pore connectivity and aggregation/packing effects. | Structural analysis indicates that increasing Ni/Mn enriches the rhombohedral component in Ni while redistributing Mn toward the monoclinic Li2MnO3-like domains, thereby modifying phase fraction and local bonding environments. These composition-dependent structural features, together with the particle-size evolution and porosity characteristics, highlight that C-rate capability is governed not only by diffusion length but also by pore connectivity and aggregation/packing effects. | |
| medium | 13 | 171 | text | body_candidate_excluded | after_back_matter_stop | after_back_matter_stop | after_stop | p13:body_region:0 | p13:bottom_margin:column_1_of_2:white | [255, 255, 255] white | [37.59, 704.16, 253.43, 38.72] | Overall, this study demonstrates a viable design strategy for cobaltfree Li-rich layered cathodes that combine high reversible capacity, competitive C-rate capability, and good cycling stability, supporting their potential for high-energy LIB applications. | Overall, this study demonstrates a viable design strategy for cobaltfree Li-rich layered cathodes that combine high reversible capacity, competitive C-rate capability, and good cycling stability, supporting their potential for high-energy LIB applications. | |
| medium | 13 | 175 | text | body_candidate_excluded | after_back_matter_stop | after_back_matter_stop | after_stop | p13:page_body:column_2_of_2:white | [255, 255, 255] white | [306.59, 610.22, 253.42, 28.23] | The authors declare that they have no known competing financial interests or personal relationships that could have appeared to influence the work reported in this paper. | The authors declare that they have no known competing financial interests or personal relationships that could have appeared to influence the work reported in this paper. | ||
| low | 1 | 0 | page_header | page_header | docling_page_header | docling_page_header | p1:top_margin:column_2_of_2:white | [255, 255, 255] white | [224.72, 33.45, 145.08, 11.73] | Journal of Power Sources 689 (2026) 240754 | Journal of Power Sources 689 (2026) 240754 | |||
| low | 1 | 1 | section_header | front_matter_heading | first_page_metadata | first_page_metadata | p1:page_body:column_2_of_2:gray | [230, 230, 230] gray | [228.42, 63.48, 140.65, 7.31] | Contents lists available at ScienceDirect | Contents lists available at ScienceDirect | |||
| low | 1 | 2 | section_header | title_candidate | non_body_heading | non_body_heading | p1:page_body:column_2_of_2:gray | [230, 230, 230] gray | [219.29, 87.36, 158.93, 12.79] | Journal of Power Sources | Journal of Power Sources | |||
| low | 1 | 3 | text | front_matter_heading | first_page_metadata | first_page_metadata | p1:page_body:column_2_of_2:gray | [230, 230, 230] gray | [195.48, 119.22, 206.54, 6.67] | journal homepage: www.elsevier.com/locate/jpowsour | journal homepage: | |||
| low | 1 | 4 | section_header | title_candidate | non_body_heading | non_body_heading | p1:page_body:column_1_of_2:white | [255, 255, 255] white | [37.59, 168.03, 450.29, 29.57] | Enhancing lithium storage in Co-free Li-rich Li1.2NixMn0.8-xO2 through the tuning Ni/Mn ratio | Enhancing lithium storage in Co-free Li-rich Li1.2NixMn0.8-xO2 through the tuning Ni/Mn ratio | |||
| low | 1 | 5 | text | affiliation | outside_body_flow_affiliation_block | outside_body_flow_affiliation_block | p1:page_body:column_1_of_2:white | [255, 255, 255] white | [45.47, 209.86, 310.62, 12.03] | ector D. Agudelo a,b , Ferley A. V ´ asquez a , Jorge A. Calder ´ on a,* | ector D. Agudelo a,b , Ferley A. V ´ asquez a , Jorge A. Calder ´ on a,* | |||
| low | 1 | 7 | list_item | affiliation | outside_body_flow_list_item | outside_body_flow_list_item | p1:page_body:column_1_of_2:white | [255, 255, 255] white | [37.59, 229.9, 410.15, 7.4] | a Centro de Investigaci ´ on, Innovaci ´ on y Desarrollo de Materiales -CIDEMAT, Universidad de Antioquia-UdeA, Calle70 N ◦ 52 -21, Medellín, Colombia | a Centro de Investigaci ´ on, Innovaci ´ on y Desarrollo de Materiales -CIDEMAT, Universidad de Antioquia-UdeA, Calle70 N ◦ 52 -21, Medellín, Colombia | |||
| low | 1 | 9 | list_item | affiliation | outside_body_flow_list_item | outside_body_flow_list_item | p1:page_body:column_1_of_2:white | [255, 255, 255] white | [42.07, 239.62, 443.76, 6.24] | Grupo de Investigaci ´ on en Energías Renovables y Meteorología-GIERMET, Universidad Tecnol ´ ogica del Choc ´ o, Facultad de Ingeniería, Programa de Telecomunicaciones | Grupo de Investigaci ´ on en Energías Renovables y Meteorología-GIERMET, Universidad Tecnol ´ ogica del Choc ´ o, Facultad de Ingeniería, Programa de Telecomunicaciones | |||
| low | 1 | 10 | list_item | affiliation | outside_body_flow_list_item | outside_body_flow_list_item | p1:page_body:column_1_of_2:white | [255, 255, 255] white | [37.59, 248.18, 148.62, 6.24] | e inform ´ atica, Cra. 22 No 18B-10B, Quibd ´ o, Colombia | e inform ´ atica, Cra. 22 No 18B-10B, Quibd ´ o, Colombia | |||
| low | 1 | 11 | section_header | front_matter_heading | front_matter_heading | front_matter_heading | p1:page_body:column_1_of_2:white | [255, 255, 255] white | [37.59, 280.77, 69.91, 6.4] | H I G H L I G H T S | H I G H L I G H T S | |||
| low | 1 | 17 | section_header | front_matter_heading | front_matter_heading | front_matter_heading | p1:page_body:column_1_of_2:white | [255, 255, 255] white | [37.59, 503.52, 78.1, 6.4] | A R T I C L E I N F O | A R T I C L E I N F O | |||
| low | 1 | 18 | text | front_matter_heading | outside_body_flow_front_matter_heading | outside_body_flow_front_matter_heading | p1:page_body:column_1_of_2:white | [255, 255, 255] white | [37.59, 522.46, 92.3, 40.09] | Keywords: Li-ion battery Cobalt free Li-rich layered oxide α -MnOOH sacrificial template Phase evolution | Keywords: Li-ion battery Cobalt free Li-rich layered oxide α -MnOOH sacrificial template Phase evolution | |||
| low | 1 | 19 | footnote | footnote | first_page_metadata | first_page_metadata | p1:page_body:column_1_of_2:white | [255, 255, 255] white | [42.63, 672.84, 206.06, 16.16] | * Corresponding author. E-mail address: andres.calderon@udea.edu.co (J.A. Calder ´ on). | * Corresponding author. E-mail address: andres.calderon@udea.edu.co (J.A. Calder ´ on). | |||
| low | 1 | 20 | section_header | metadata | first_page_metadata | first_page_metadata | p1:page_body:column_1_of_2:white | [255, 255, 255] white | [37.59, 699.43, 158.54, 6.58] | https://doi.org/10.1016/j.jpowsour.2026.240754 | ||||
| low | 1 | 21 | text | reference | first_page_metadata | first_page_metadata | p1:page_body:column_1_of_2:white | [255, 255, 255] white | [37.59, 708.95, 289.7, 6.58] | Received 4 March 2026; Received in revised form 27 May 2026; Accepted 15 June 2026 | Received 4 March 2026; Received in revised form 27 May 2026; Accepted 15 June 2026 | |||
| low | 1 | 27 | section_header | title_candidate | non_body_heading | non_body_heading | p1:page_body:column_2_of_2:white | [255, 255, 255] white | [201.99, 280.77, 125.99, 6.4] | G R A P H I C A L A B S T R A C T | G R A P H I C A L A B S T R A C T | |||
| low | 1 | 28 | section_header | abstract_heading | abstract_heading | abstract_heading | p1:page_body:column_2_of_2:white | [255, 255, 255] white | [202.0, 503.52, 56.72, 6.4] | A B S T R A C T | A B S T R A C T | |||
| low | 1 | 30 | page_footer | page_footer | first_page_metadata | first_page_metadata | p1:bottom_margin:column_1_of_2:white | [255, 255, 255] white | [37.52, 722.79, 522.15, 21.3] | 0378-7753/© 2026 The Authors. Published by Elsevier B.V. This is an open access article under the CC BY-NC-ND license ( http://creativecommons.org/licenses/bync-nd/4.0/ ). | 0378-7753/© 2026 The Authors. Published by Elsevier B.V. This is an open access article under the CC BY-NC-ND license ( ). | |||
| low | 2 | 31 | page_header | page_header | docling_page_header | docling_page_header | p2:body_region:1 | p2:top_margin:column_2_of_2:white | [255, 255, 255] white | [433.38, 33.66, 124.91, 10.42] | Journal of Power Sources 689 (2026) 240754 | Journal of Power Sources 689 (2026) 240754 | ||
| low | 2 | 32 | text | page_margin_header | page_margin_header | page_margin_header | p2:body_region:0 | p2:top_margin:column_1_of_2:white | [255, 255, 255] white | [37.59, 36.99, 464.67, 5.85] | H.D. Agudelo et al. | H.D. Agudelo et al. | ||
| low | 2 | 33 | section_header | body_heading | body_heading | body_heading | p2:body_region:0 | p2:top_margin:column_1_of_2:white | [255, 255, 255] white | [37.59, 55.48, 60.25, 7.31] | 1. Introduction | 1. Introduction | ||
| low | 2 | 36 | caption | caption | outside_body_flow_caption | outside_body_flow_caption | p2:body_region:0 | p2:bottom_margin:column_1_of_2:white | [255, 255, 255] white | [37.59, 698.35, 253.17, 44.79] | Fig. 1. (a) Structural schematic of the Co-free Li-rich layered oxides generated using VESTA. (b) Thermogravimetric analysis (TGA) and derivative thermogravimetry (DTG) curves of the Li/Ni-incorporated precursors for L-NM 26, LNM 35, and L-NM 44 measured in air. The inset shows an enlarged view of the 330 -700 ◦ C region. | Fig. 1. (a) Structural schematic of the Co-free Li-rich layered oxides generated using VESTA. (b) Thermogravimetric analysis (TGA) and derivative thermogravimetry (DTG) curves of the Li/Ni-incorporated precursors for L-NM 26, LNM 35, and L-NM 44 measured in air. The inset shows an enlarged view of the 330 -700 ◦ C region. | ||
| low | 2 | 42 | page_footer | page_footer | docling_page_footer | docling_page_footer | p2:bottom_margin:column_2_of_2:white | [255, 255, 255] white | [296.21, 754.46, 3.59, 10.42] | 2 | 2 | |||
| low | 3 | 43 | page_header | page_header | docling_page_header | docling_page_header | p3:body_region:1 | p3:top_margin:column_2_of_2:white | [255, 255, 255] white | [433.38, 33.66, 124.91, 10.42] | Journal of Power Sources 689 (2026) 240754 | Journal of Power Sources 689 (2026) 240754 | ||
| low | 3 | 44 | text | page_margin_header | page_margin_header | page_margin_header | p3:body_region:0 | p3:top_margin:column_1_of_2:white | [255, 255, 255] white | [37.59, 36.99, 464.67, 5.85] | H.D. Agudelo et al. | H.D. Agudelo et al. | ||
| low | 3 | 47 | section_header | body_heading | body_heading | body_heading | p3:body_region:0 | p3:body_zone:column_1_of_2:white | [255, 255, 255] white | [37.59, 393.26, 62.96, 7.31] | 2. Experimental | 2. Experimental | ||
| low | 3 | 48 | section_header | body_heading | body_heading | body_heading | p3:body_region:0 | p3:body_zone:column_1_of_2:white | [255, 255, 255] white | [37.59, 414.18, 78.39, 7.31] | 2.1. Material synthesis | 2.1. Material synthesis | ||
| low | 3 | 50 | section_header | body_heading | body_heading | body_heading | p3:body_region:0 | p3:body_zone:column_1_of_2:white | [255, 255, 255] white | [37.59, 600.08, 103.02, 7.31] | 2.2. Material characterization | 2.2. Material characterization | ||
| low | 3 | 52 | text | back_matter_heading | back_matter_heading | back_matter_heading | stop_trigger | p3:body_region:1 | p3:top_margin:column_2_of_2:white | [255, 255, 255] white | [306.59, 55.49, 85.51, 7.31] | Supporting Information. | Supporting Information. | |
| low | 3 | 53 | section_header | body_heading | after_back_matter_stop | after_back_matter_stop | after_stop | p3:body_region:1 | p3:body_zone:column_2_of_2:white | [255, 255, 255] white | [306.59, 76.92, 126.83, 7.31] | 2.3. Electrochemical characterization | 2.3. Electrochemical characterization | |
| low | 3 | 55 | section_header | body_heading | after_back_matter_stop | after_back_matter_stop | after_stop | p3:body_region:1 | p3:body_zone:column_2_of_2:white | [255, 255, 255] white | [306.6, 275.79, 102.17, 7.31] | 3. Results and discussions | 3. Results and discussions | |
| low | 3 | 56 | section_header | body_heading | after_back_matter_stop | after_back_matter_stop | after_stop | p3:body_region:1 | p3:body_zone:column_2_of_2:white | [255, 255, 255] white | [306.6, 296.71, 75.32, 7.31] | 3.1. Thermal analysis | 3.1. Thermal analysis | |
| low | 3 | 61 | page_footer | page_footer | after_back_matter_stop | after_back_matter_stop | after_stop | p3:bottom_margin:column_2_of_2:white | [255, 255, 255] white | [296.21, 754.46, 3.59, 10.42] | 3 | 3 | ||
| low | 4 | 62 | page_header | page_header | after_back_matter_stop | after_back_matter_stop | after_stop | p4:body_region:1 | p4:top_margin:column_2_of_2:white | [255, 255, 255] white | [433.38, 33.66, 124.91, 10.42] | Journal of Power Sources 689 (2026) 240754 | Journal of Power Sources 689 (2026) 240754 | |
| low | 4 | 63 | text | page_margin_header | after_back_matter_stop | after_back_matter_stop | after_stop | p4:body_region:0 | p4:top_margin:column_1_of_2:white | [255, 255, 255] white | [37.59, 36.99, 464.67, 5.85] | H.D. Agudelo et al. | H.D. Agudelo et al. | |
| low | 4 | 65 | section_header | body_heading | after_back_matter_stop | after_back_matter_stop | after_stop | p4:body_region:0 | p4:body_zone:column_1_of_2:white | [255, 255, 255] white | [37.59, 136.72, 155.62, 7.31] | 3.2. Morphological and elemental distribution | 3.2. Morphological and elemental distribution | |
| low | 4 | 71 | caption | caption | after_back_matter_stop | after_back_matter_stop | after_stop | p4:bottom_margin:column_1_of_2:white | [255, 255, 255] white | [37.59, 717.45, 522.17, 25.69] | Fig. 2. Scanning electron micrograph of active materials (powders) after thermal treatment and before cycling in air atmosphere, along with the corresponding scaled-shaped individual particle size distributions displays on the right side. (a, b) L-NM 26, (c, d) L- NM 35 and (e, f) L-NM 44. The right-side plots are SEM-derived particle-size distributions from image analysis, not EDS depth profiles, etching profiles, or differential total-signal curves. | Fig. 2. Scanning electron micrograph of active materials (powders) after thermal treatment and before cycling in air atmosphere, along with the corresponding scaled-shaped individual particle size distributions displays on the right side. (a, b) L-NM 26, (c, d) L- NM 35 and (e, f) L-NM 44. The right-side plots are SEM-derived particle-size distributions from image analysis, not EDS depth profiles, etching profiles, or differential total-signal curves. | ||
| low | 4 | 72 | page_footer | page_footer | after_back_matter_stop | after_back_matter_stop | after_stop | p4:bottom_margin:column_2_of_2:white | [255, 255, 255] white | [296.21, 754.46, 3.59, 10.42] | 4 | 4 | ||
| low | 5 | 73 | page_header | page_header | after_back_matter_stop | after_back_matter_stop | after_stop | p5:body_region:1 | p5:top_margin:column_2_of_2:white | [255, 255, 255] white | [433.38, 33.66, 124.91, 10.42] | Journal of Power Sources 689 (2026) 240754 | Journal of Power Sources 689 (2026) 240754 | |
| low | 5 | 74 | text | page_margin_header | after_back_matter_stop | after_back_matter_stop | after_stop | p5:body_region:0 | p5:top_margin:column_1_of_2:white | [255, 255, 255] white | [37.59, 36.99, 464.67, 5.85] | H.D. Agudelo et al. | H.D. Agudelo et al. | |
| low | 5 | 75 | text | back_matter_text | after_back_matter_stop | after_back_matter_stop | after_stop | p5:body_region:0 | p5:top_margin:column_1_of_2:white | [255, 255, 255] white | [37.59, 55.48, 253.44, 81.63] | data should not be interpreted as a depth-resolved interior/exterior composition profile. Instead, the EDS maps support local compositional heterogeneity at the particle scale, while the coexistence of R3m and C2/ m domains is supported by the combined XRD, Raman, and HRTEM evidence. For L-NM26, although XRD confirms the presence of both phases (Section 4.3), EDS does not clearly resolve separated Ni-rich and Mn-rich regions, indicating a more homogeneous distribution at the SEM/EDS spatial resolution. | data should not be interpreted as a depth-resolved interior/exterior composition profile. Instead, the EDS maps support local compositional heterogeneity at the particle scale, while the coexistence of R3m and C2/ m domains is supported by the combined XRD, Raman, and HRTEM evidence. For L-NM26, although XRD confirms the presence of both phases (Section 4.3), EDS does not clearly resolve separated Ni-rich and Mn-rich regions, indicating a more homogeneous distribution at the SEM/EDS spatial resolution. | |
| low | 5 | 80 | caption | caption | after_back_matter_stop | after_back_matter_stop | after_stop | p5:bottom_margin:column_1_of_2:white | [255, 255, 255] white | [37.59, 698.35, 522.2, 44.79] | Fig. 3. Results of TEM and HRTEM study of the layer samples of active materials (powders) after thermal treatment and before cycling in air atmosphere, Fourier transform of TEM Images and local d-spacing Vector Variations for each sample at the right side. (a, b) Results of HRTEM and Local d-spacing vector variation of HRTEM for the sample L-NM 26, respectively (c, d) Results of HRTEM and Local d-spacing vector variation of HRTEM for the sample L-NM 44, respectively (e, f) LNM 35. Fast Fourier Transform-FFT images at the ride side of each HRTEM. Enlarge region embedded in each HRTEM image to show Stacking Fauls. Color-full bar dspacing in nm. (For interpretation of the references to color in this figure legend, the reader is referred to the Web version of this article.) | Fig. 3. Results of TEM and HRTEM study of the layer samples of active materials (powders) after thermal treatment and before cycling in air atmosphere, Fourier transform of TEM Images and local d-spacing Vector Variations for each sample at the right side. (a, b) Results of HRTEM and Local d-spacing vector variation of HRTEM for the sample L-NM 26, respectively (c, d) Results of HRTEM and Local d-spacing vector variation of HRTEM for the sample L-NM 44, respectively (e, f) LNM 35. Fast Fourier Transform-FFT images at the ride side of each HRTEM. Enlarge region embedded in each HRTEM image to show Stacking Fauls. Color-full bar dspacing in nm. (For interpretation of the references to color in this figure legend, the reader is referred to the Web version of this article.) | ||
| low | 5 | 81 | page_footer | page_footer | after_back_matter_stop | after_back_matter_stop | after_stop | p5:bottom_margin:column_2_of_2:white | [255, 255, 255] white | [296.21, 754.46, 3.59, 10.42] | 5 | 5 | ||
| low | 6 | 82 | page_header | page_header | after_back_matter_stop | after_back_matter_stop | after_stop | p6:body_region:1 | p6:top_margin:column_2_of_2:white | [255, 255, 255] white | [433.38, 33.66, 124.91, 10.42] | Journal of Power Sources 689 (2026) 240754 | Journal of Power Sources 689 (2026) 240754 | |
| low | 6 | 83 | text | page_margin_header | after_back_matter_stop | after_back_matter_stop | after_stop | p6:body_region:0 | p6:top_margin:column_1_of_2:white | [255, 255, 255] white | [37.59, 36.99, 464.67, 5.85] | H.D. Agudelo et al. | H.D. Agudelo et al. | |
| low | 6 | 86 | section_header | body_heading | after_back_matter_stop | after_back_matter_stop | after_stop | p6:body_region:0 | p6:body_zone:column_1_of_2:white | [255, 255, 255] white | [37.59, 370.13, 155.18, 7.31] | 3.3. Chemical and structural characterization | 3.3. Chemical and structural characterization | |
| low | 6 | 89 | caption | caption | after_back_matter_stop | after_back_matter_stop | after_stop | p6:body_region:0 | p6:body_zone:column_1_of_2:white | [255, 255, 255] white | [37.59, 613.03, 27.29, 25.74] | Table 1 44 a . | Table 1 44 a . | |
| low | 6 | 90 | caption | caption | after_back_matter_stop | after_back_matter_stop | after_stop | p6:body_region:0 | p6:body_zone:column_1_of_2:white | [255, 255, 255] white | [37.59, 622.61, 253.18, 6.58] | Results of chemical composition analysis by ICP of L-NM 26, L-NM 35 and L-NM | Results of chemical composition analysis by ICP of L-NM 26, L-NM 35 and L-NM | |
| low | 6 | 93 | text | back_matter_text | after_back_matter_stop | after_back_matter_stop | after_stop | p6:body_region:1 | p6:front_matter:column_2_of_2:white | [255, 255, 255] white | [306.6, 84.66, 253.43, 155.98] | For L-NM 26, the band in the ~450 -485 cm 1 region is centered at ~453 cm 1 (S1) and ~480 cm 1 (S2), while the A1 g band remains near ~583 cm 1 in both cases. The shift between S1 and S2, together with the appearance of a Li -O-related feature at ~425 cm 1 in S2, indicates that S2 is associated with Mn-rich, Li2MnO3-like environments, whereas S1 corresponds to Ni-enriched regions [13]. This assignment is consistent with SEM -EDS evidence of Mn-rich and Ni-rich regions (Table S4 -S5 for L-NM 35, Table S7 -S8 for L-NM 44, and Fig. S7). For comparison, LiNiO2 typically exhibits dominant Raman bands (E g ~465 cm 1 , A1 g ~545 cm 1 ), and pronounced broadening has been associated with increased disorder/degeneration of the rhombohedral framework [41]. In the present samples, the comparatively narrower spectral shapes, particularly for S1, suggest that the rhombohedral component remains well preserved within both Ni-rich and Mn-rich regions, in agreement with the two-phase picture supported by XRD (Table 2). | For L-NM 26, the band in the ~450 -485 cm 1 region is centered at ~453 cm 1 (S1) and ~480 cm 1 (S2), while the A1 g band remains near ~583 cm 1 in both cases. The shift between S1 and S2, together with the appearance of a Li -O-related feature at ~425 cm 1 in S2, indicates that S2 is associated with Mn-rich, Li2MnO3-like environments, whereas S1 corresponds to Ni-enriched regions [13]. This assignment is consistent with SEM -EDS evidence of Mn-rich and Ni-rich regions (Table S4 -S5 for L-NM 35, Table S7 -S8 for L-NM 44, and Fig. S7). For comparison, LiNiO2 typically exhibits dominant Raman bands (E g ~465 cm 1 , A1 g ~545 cm 1 ), and pronounced broadening has been associated with increased disorder/degeneration of the rhombohedral framework [41]. In the present samples, the comparatively narrower spectral shapes, particularly for S1, suggest that the rhombohedral component remains well preserved within both Ni-rich and Mn-rich regions, in agreement with the two-phase picture supported by XRD (Table 2). | |
| low | 6 | 98 | page_footer | page_footer | after_back_matter_stop | after_back_matter_stop | after_stop | p6:bottom_margin:column_2_of_2:white | [255, 255, 255] white | [296.21, 754.46, 3.59, 10.42] | 6 | 6 | ||
| low | 7 | 99 | page_header | page_header | after_back_matter_stop | after_back_matter_stop | after_stop | p7:body_region:1 | p7:top_margin:column_2_of_2:white | [255, 255, 255] white | [433.38, 33.66, 124.91, 10.42] | Journal of Power Sources 689 (2026) 240754 | Journal of Power Sources 689 (2026) 240754 | |
| low | 7 | 100 | text | page_margin_header | after_back_matter_stop | after_back_matter_stop | after_stop | p7:body_region:0 | p7:top_margin:column_1_of_2:white | [255, 255, 255] white | [37.59, 36.99, 464.67, 5.85] | H.D. Agudelo et al. | H.D. Agudelo et al. | |
| low | 7 | 101 | caption | caption | after_back_matter_stop | after_back_matter_stop | after_stop | p7:page_body:column_1_of_2:white | [255, 255, 255] white | [62.19, 399.69, 470.86, 6.58] | Fig. 4. Raman spectra of the L-NM 26, L-NM 35 and L-NM 44 active materials. The classified spectra are marked as S1 and S2 in Figs. S4 and S5. | Fig. 4. Raman spectra of the L-NM 26, L-NM 35 and L-NM 44 active materials. The classified spectra are marked as S1 and S2 in Figs. S4 and S5. | ||
| low | 7 | 102 | caption | caption | after_back_matter_stop | after_back_matter_stop | after_stop | p7:body_region:0 | p7:page_body:column_1_of_2:white | [255, 255, 255] white | [37.59, 428.94, 398.37, 17.12] | Table 2 Lattice parameters of the R3m space group and phase quantification of the active materials L-NM 26, L-NM 35 and L-NM 44. | Table 2 Lattice parameters of the R3m space group and phase quantification of the active materials L-NM 26, L-NM 35 and L-NM 44. | |
| low | 7 | 103 | footnote | footnote | after_back_matter_stop | after_back_matter_stop | after_stop | p7:page_body:column_1_of_2:white | [255, 255, 255] white | [43.2, 530.51, 509.44, 8.31] | a Equivalent chemical formula (Calculated by the authors of this work) = Li[Li0.13Ni0.202Co0.202Mn0.463]O2. * *Calculated by the authors of this report. ***No reported . | a Equivalent chemical formula (Calculated by the authors of this work) = Li[Li0.13Ni0.202Co0.202Mn0.463]O2. * *Calculated by the authors of this report. ***No reported . | ||
| low | 7 | 104 | text | unknown_text | after_back_matter_stop | after_back_matter_stop | after_stop | p7:body_region:0 | p7:page_body:column_1_of_2:white | [255, 255, 255] white | [37.59, 554.1, 253.43, 17.8] | 44, respectively, supporting a slight reduction of diffusion length with increasing Ni/Mn ratio and consistent with the BET-derived trend. | 44, respectively, supporting a slight reduction of diffusion length with increasing Ni/Mn ratio and consistent with the BET-derived trend. | |
| low | 7 | 110 | page_footer | page_footer | after_back_matter_stop | after_back_matter_stop | after_stop | p7:bottom_margin:column_2_of_2:white | [255, 255, 255] white | [296.21, 754.46, 3.59, 10.42] | 7 | 7 | ||
| low | 8 | 111 | page_header | page_header | after_back_matter_stop | after_back_matter_stop | after_stop | p8:top_margin:column_2_of_2:white | [255, 255, 255] white | [433.38, 33.66, 124.91, 10.42] | Journal of Power Sources 689 (2026) 240754 | Journal of Power Sources 689 (2026) 240754 | ||
| low | 8 | 112 | text | page_margin_header | after_back_matter_stop | after_back_matter_stop | after_stop | p8:top_margin:column_1_of_2:white | [255, 255, 255] white | [37.59, 36.99, 464.67, 5.85] | H.D. Agudelo et al. | H.D. Agudelo et al. | ||
| low | 8 | 114 | caption | caption | after_back_matter_stop | after_back_matter_stop | after_stop | p8:page_body:column_2_of_2:white | [255, 255, 255] white | [179.66, 667.39, 235.95, 6.58] | Fig. 5. X-ray diffraction of the samples L-NM 26, L-NM 35 and L-NM 44. | Fig. 5. X-ray diffraction of the samples L-NM 26, L-NM 35 and L-NM 44. | ||
| low | 8 | 116 | page_footer | page_footer | after_back_matter_stop | after_back_matter_stop | after_stop | p8:bottom_margin:column_2_of_2:white | [255, 255, 255] white | [296.21, 754.46, 3.59, 10.42] | 8 | 8 | ||
| low | 9 | 117 | page_header | page_header | after_back_matter_stop | after_back_matter_stop | after_stop | p9:top_margin:column_2_of_2:white | [255, 255, 255] white | [433.38, 33.66, 124.91, 10.42] | Journal of Power Sources 689 (2026) 240754 | Journal of Power Sources 689 (2026) 240754 | ||
| low | 9 | 118 | text | page_margin_header | after_back_matter_stop | after_back_matter_stop | after_stop | p9:top_margin:column_1_of_2:white | [255, 255, 255] white | [37.59, 36.99, 464.67, 5.85] | H.D. Agudelo et al. | H.D. Agudelo et al. | ||
| low | 9 | 119 | caption | caption | after_back_matter_stop | after_back_matter_stop | after_stop | p9:top_margin:column_1_of_2:white | [255, 255, 255] white | [37.59, 56.3, 154.17, 17.12] | Table 3 Crystallographic results from R3m space group a . | Table 3 Crystallographic results from R3m space group a . | ||
| low | 9 | 120 | footnote | footnote | after_back_matter_stop | after_back_matter_stop | after_stop | p9:page_body:column_1_of_2:white | [255, 255, 255] white | [37.59, 238.65, 522.19, 17.89] | a Note: Crystallographic dates of the monoclinic phase are not considered relevant because it is a transition phase, only important during the first charge/discharge cycle. However, phase content and the lattice parameters are reported in Table S9 in the supporting information. | a Note: Crystallographic dates of the monoclinic phase are not considered relevant because it is a transition phase, only important during the first charge/discharge cycle. However, phase content and the lattice parameters are reported in Table S9 in the supporting information. | ||
| low | 9 | 122 | caption | caption | after_back_matter_stop | after_back_matter_stop | after_stop | p9:bottom_margin:column_1_of_2:white | [255, 255, 255] white | [93.77, 736.56, 407.72, 6.58] | Fig. 6. XPS spectra and high-resolution regions Ni2p, Mn2p, and O1s of the active materials L-NM 26, L-NM 35 and L-NM 44. | Fig. 6. XPS spectra and high-resolution regions Ni2p, Mn2p, and O1s of the active materials L-NM 26, L-NM 35 and L-NM 44. | ||
| low | 9 | 125 | page_footer | page_footer | after_back_matter_stop | after_back_matter_stop | after_stop | p9:bottom_margin:column_2_of_2:white | [255, 255, 255] white | [296.21, 754.46, 3.59, 10.42] | 9 | 9 | ||
| low | 10 | 126 | page_header | page_header | after_back_matter_stop | after_back_matter_stop | after_stop | p10:body_region:1 | p10:top_margin:column_2_of_2:white | [255, 255, 255] white | [433.38, 33.66, 124.91, 10.42] | Journal of Power Sources 689 (2026) 240754 | Journal of Power Sources 689 (2026) 240754 | |
| low | 10 | 127 | text | page_margin_header | after_back_matter_stop | after_back_matter_stop | after_stop | p10:body_region:0 | p10:top_margin:column_1_of_2:white | [255, 255, 255] white | [37.59, 37.0, 464.67, 5.85] | H.D. Agudelo et al. | H.D. Agudelo et al. | |
| low | 10 | 128 | caption | caption | after_back_matter_stop | after_back_matter_stop | after_stop | p10:body_region:0 | p10:top_margin:column_1_of_2:white | [255, 255, 255] white | [37.59, 56.3, 253.19, 35.27] | Table 4 Ni2p3/2, Mn2p3/2 and Mn3s spectral fitting parameters: binding energy (eV) for each active material, percentage of the total area of Ni2p3/2 region for each active material and Δ eV in the Mn3s region for each active material. | Table 4 Ni2p3/2, Mn2p3/2 and Mn3s spectral fitting parameters: binding energy (eV) for each active material, percentage of the total area of Ni2p3/2 region for each active material and Δ eV in the Mn3s region for each active material. | |
| low | 10 | 129 | text | unknown_text | after_back_matter_stop | after_back_matter_stop | after_stop | p10:body_region:0 | p10:body_zone:column_1_of_2:white | [255, 255, 255] white | [37.59, 202.32, 253.4, 17.8] | that tuning the Ni/Mn ratio in Li1.2Mn0.8 x Ni x O2 (x = 0.2, 0.3, 0.4) modifies the surface redox-state distribution. | that tuning the Ni/Mn ratio in Li1.2Mn0.8 x Ni x O2 (x = 0.2, 0.3, 0.4) modifies the surface redox-state distribution. | |
| low | 10 | 130 | text | back_matter_text | after_back_matter_stop | after_back_matter_stop | after_stop | p10:body_region:0 | p10:body_zone:column_1_of_2:white | [255, 255, 255] white | [37.59, 221.06, 253.44, 135.01] | Semi-quantitative analysis indicates that the Ni 2 + contribution decreases as Ni/Mn increases from 0.33 to 0.60, but increases again at Ni/ Mn = 1.0, whereas Ni 3 + is more pronounced for L-NM 35 and L-NM 44 than for L-NM 26, suggesting that higher Ni/Mn generally promotes Ni 3 + formation (Table 4). Notably, L-NM 44 exhibits evidence of a surface Li2CO3-related layer (supported by TGA, TEM, and XRD), which can reduce the electrochemically active surface area and is consistent with the relatively stronger Ni 2 + -related contribution observed in its Ni 2p spectrum (Fig. 7). In addition, the Ni 2 + -related component shifts to lower binding energy from Ni/Mn = 0.33 to 0.60, consistent with an increased average Ni oxidation state; the trend partially reverses at Ni/ Mn = 1.0, indicating redistribution of surface redox states and/or phasedependent chemistry. | Semi-quantitative analysis indicates that the Ni 2 + contribution decreases as Ni/Mn increases from 0.33 to 0.60, but increases again at Ni/ Mn = 1.0, whereas Ni 3 + is more pronounced for L-NM 35 and L-NM 44 than for L-NM 26, suggesting that higher Ni/Mn generally promotes Ni 3 + formation (Table 4). Notably, L-NM 44 exhibits evidence of a surface Li2CO3-related layer (supported by TGA, TEM, and XRD), which can reduce the electrochemically active surface area and is consistent with the relatively stronger Ni 2 + -related contribution observed in its Ni 2p spectrum (Fig. 7). In addition, the Ni 2 + -related component shifts to lower binding energy from Ni/Mn = 0.33 to 0.60, consistent with an increased average Ni oxidation state; the trend partially reverses at Ni/ Mn = 1.0, indicating redistribution of surface redox states and/or phasedependent chemistry. | |
| low | 10 | 135 | section_header | body_heading | after_back_matter_stop | after_back_matter_stop | after_stop | p10:body_region:1 | p10:body_zone:column_2_of_2:white | [255, 255, 255] white | [306.6, 129.35, 151.65, 7.31] | 3.4. Electrochemical performance evaluation | 3.4. Electrochemical performance evaluation | |
| low | 10 | 140 | page_footer | page_footer | after_back_matter_stop | after_back_matter_stop | after_stop | p10:bottom_margin:column_2_of_2:white | [255, 255, 255] white | [294.42, 754.46, 7.18, 10.42] | 10 | 10 | ||
| low | 11 | 141 | page_header | page_header | after_back_matter_stop | after_back_matter_stop | after_stop | p11:body_region:1 | p11:top_margin:column_2_of_2:white | [255, 255, 255] white | [433.38, 33.66, 124.91, 10.42] | Journal of Power Sources 689 (2026) 240754 | Journal of Power Sources 689 (2026) 240754 | |
| low | 11 | 142 | text | page_margin_header | after_back_matter_stop | after_back_matter_stop | after_stop | p11:body_region:0 | p11:top_margin:column_1_of_2:white | [255, 255, 255] white | [37.59, 36.99, 464.67, 5.85] | H.D. Agudelo et al. | H.D. Agudelo et al. | |
| low | 11 | 143 | caption | caption | after_back_matter_stop | after_back_matter_stop | after_stop | p11:page_body:column_1_of_2:white | [255, 255, 255] white | [37.59, 558.97, 522.18, 46.58] | Fig. 7. (a) Charge -discharge voltage profiles of the L-NM 26, L-NM 35 and L-NM 44 between 2.0 and 4.8 V at a current density of 20 mA g 1 (0.1C) at room temperature and in the ride side the corresponding differential capacity curves for the cycles 1, 2, 30 and 80. (b) Cycling performance at 20 mA g 1 (0.1C) over a 2.0 -4.8 V voltage window is compared for the samples L-NM 26, L-NM 35 and L-NM 44. (c) Cycling stability curves performed at different C-rates over a 2.0 -4.8 V voltage window are compared for the samples L-NM 26, L-NM 35, L-NM 44, and L-NM 35, and L-NM 35 in CCCV mode. (d) Cycling performance of the Li1.2Ni0.3Mn0.5O2/graphite 18650 full cell, reported as full-cell discharge capacity (mAh) with the corresponding Coulombic efficiency over 32 cycles. | Fig. 7. (a) Charge -discharge voltage profiles of the L-NM 26, L-NM 35 and L-NM 44 between 2.0 and 4.8 V at a current density of 20 mA g 1 (0.1C) at room temperature and in the ride side the corresponding differential capacity curves for the cycles 1, 2, 30 and 80. (b) Cycling performance at 20 mA g 1 (0.1C) over a 2.0 -4.8 V voltage window is compared for the samples L-NM 26, L-NM 35 and L-NM 44. (c) Cycling stability curves performed at different C-rates over a 2.0 -4.8 V voltage window are compared for the samples L-NM 26, L-NM 35, L-NM 44, and L-NM 35, and L-NM 35 in CCCV mode. (d) Cycling performance of the Li1.2Ni0.3Mn0.5O2/graphite 18650 full cell, reported as full-cell discharge capacity (mAh) with the corresponding Coulombic efficiency over 32 cycles. | ||
| low | 11 | 147 | page_footer | page_footer | after_back_matter_stop | after_back_matter_stop | after_stop | p11:bottom_margin:column_2_of_2:white | [255, 255, 255] white | [294.42, 754.46, 7.18, 10.42] | 11 | 11 | ||
| low | 12 | 148 | page_header | page_header | after_back_matter_stop | after_back_matter_stop | after_stop | p12:body_region:1 | p12:top_margin:column_2_of_2:white | [255, 255, 255] white | [433.38, 33.66, 124.91, 10.42] | Journal of Power Sources 689 (2026) 240754 | Journal of Power Sources 689 (2026) 240754 | |
| low | 12 | 149 | text | page_margin_header | after_back_matter_stop | after_back_matter_stop | after_stop | p12:body_region:0 | p12:top_margin:column_1_of_2:white | [255, 255, 255] white | [37.59, 36.99, 464.67, 5.85] | H.D. Agudelo et al. | H.D. Agudelo et al. | |
| low | 12 | 150 | caption | caption | after_back_matter_stop | after_back_matter_stop | after_stop | p12:body_region:0 | p12:top_margin:column_1_of_2:white | [255, 255, 255] white | [37.59, 56.3, 392.97, 16.16] | Table 5 Comparison of electrochemical performance for Li-rich layer cathode cell in the current work and previous reported works. | Table 5 Comparison of electrochemical performance for Li-rich layer cathode cell in the current work and previous reported works. | |
| low | 12 | 151 | text | unknown_text | after_back_matter_stop | after_back_matter_stop | after_stop | p12:body_region:0 | p12:front_matter:column_1_of_2:white | [255, 255, 255] white | [37.59, 251.95, 55.78, 6.58] | NR = No reported | NR = No reported | |
| low | 12 | 152 | footnote | footnote | after_back_matter_stop | after_back_matter_stop | after_stop | p12:body_region:0 | p12:front_matter:column_1_of_2:white | [255, 255, 255] white | [43.2, 259.8, 214.28, 8.31] | a These values were taken from the graph presented by the author. | a These values were taken from the graph presented by the author. | |
| low | 12 | 153 | footnote | footnote | after_back_matter_stop | after_back_matter_stop | after_stop | p12:body_region:0 | p12:front_matter:column_1_of_2:white | [255, 255, 255] white | [43.2, 269.38, 272.53, 8.31] | b The author introduced C, N, and S in the superficial of solid solution with thiourea. | b The author introduced C, N, and S in the superficial of solid solution with thiourea. | |
| low | 12 | 154 | footnote | footnote | after_back_matter_stop | after_back_matter_stop | after_stop | p12:body_region:0 | p12:front_matter:column_1_of_2:white | [255, 255, 255] white | [43.2, 278.91, 129.13, 8.37] | c Synthesis by sol-freeze-drying method. | c Synthesis by sol-freeze-drying method. | |
| low | 12 | 155 | footnote | footnote | after_back_matter_stop | after_back_matter_stop | after_stop | p12:body_region:0 | p12:front_matter:column_1_of_2:white | [255, 255, 255] white | [43.2, 288.49, 140.13, 8.31] | d Synthesis by MOF Assisted Hydrothermal. | d Synthesis by MOF Assisted Hydrothermal. | |
| low | 12 | 159 | text | unknown_text | after_back_matter_stop | after_back_matter_stop | after_stop | p12:body_region:1 | p12:front_matter:column_2_of_2:white | [255, 255, 255] white | [306.59, 312.14, 100.8, 7.31] | higher estimated coefficient. | higher estimated coefficient. | |
| low | 12 | 163 | section_header | body_heading | after_back_matter_stop | after_back_matter_stop | after_stop | p12:body_region:1 | p12:body_zone:column_2_of_2:white | [255, 255, 255] white | [306.6, 668.9, 54.33, 7.31] | 4. Conclusion | 4. Conclusion | |
| low | 12 | 165 | page_footer | page_footer | after_back_matter_stop | after_back_matter_stop | after_stop | p12:bottom_margin:column_2_of_2:white | [255, 255, 255] white | [294.42, 754.46, 7.18, 10.42] | 12 | 12 | ||
| low | 13 | 166 | page_header | page_header | after_back_matter_stop | after_back_matter_stop | after_stop | p13:top_margin:column_2_of_2:white | [255, 255, 255] white | [433.38, 33.66, 124.91, 10.42] | Journal of Power Sources 689 (2026) 240754 | Journal of Power Sources 689 (2026) 240754 | ||
| low | 13 | 167 | text | page_margin_header | after_back_matter_stop | after_back_matter_stop | after_stop | p13:body_region:0 | p13:top_margin:column_1_of_2:white | [255, 255, 255] white | [37.59, 36.99, 464.67, 5.85] | H.D. Agudelo et al. | H.D. Agudelo et al. | |
| low | 13 | 168 | caption | caption | after_back_matter_stop | after_back_matter_stop | after_stop | p13:page_body:column_1_of_2:white | [255, 255, 255] white | [37.59, 423.3, 522.18, 65.74] | Fig. 8. The electrochemical impedance of samples L-NM 26 (black color), L-NM 35 (green color) and L-NM 44 (red color) at a charge constant current of 20 mA g 1 (1C = 200 mA g 1 ) for 4h and comparative electrochemical impedance performed of samples after 2nd and 10th cycles. The right side of the Nyquist diagrams for each sample displays experimental values (scatter) alongside fitted values (lines), while the lower section of the Bode diagram presents the corresponding data. In the equivalent circuit, Rs represents the ohmic/electrolyte resistance, RCEI the cathode/electrolyte interphase resistance, Rct1 and Rct2 the charge-transfer resistance contributions, φ CEI, φ dl1, and φ dl2 the corresponding constant-phase elements, W the Warburg diffusion element, and τ CEI, τ dl1, and τ dl2 the characteristic relaxation times associated with the corresponding impedance processes. (For interpretation of the references to color in this figure legend, the reader is referred to the Web version of this article.) | Fig. 8. The electrochemical impedance of samples L-NM 26 (black color), L-NM 35 (green color) and L-NM 44 (red color) at a charge constant current of 20 mA g 1 (1C = 200 mA g 1 ) for 4h and comparative electrochemical impedance performed of samples after 2nd and 10th cycles. The right side of the Nyquist diagrams for each sample displays experimental values (scatter) alongside fitted values (lines), while the lower section of the Bode diagram presents the corresponding data. In the equivalent circuit, Rs represents the ohmic/electrolyte resistance, RCEI the cathode/electrolyte interphase resistance, Rct1 and Rct2 the charge-transfer resistance contributions, φ CEI, φ dl1, and φ dl2 the corresponding constant-phase elements, W the Warburg diffusion element, and τ CEI, τ dl1, and τ dl2 the characteristic relaxation times associated with the corresponding impedance processes. (For interpretation of the references to color in this figure legend, the reader is referred to the Web version of this article.) | ||
| low | 13 | 172 | section_header | back_matter_heading | after_back_matter_stop | after_back_matter_stop | after_stop | p13:page_body:column_2_of_2:white | [255, 255, 255] white | [306.59, 504.32, 161.94, 7.31] | CRediT authorship contribution statement | CRediT authorship contribution statement | ||
| low | 13 | 173 | text | back_matter_text | after_back_matter_stop | after_back_matter_stop | after_stop | p13:page_body:column_2_of_2:white | [255, 255, 255] white | [306.59, 524.74, 253.4, 49.65] | H ´ ector D. Agudelo: Investigation, Methodology, Writing -original draft. Ferley A. V ´ asquez: Conceptualization, Formal analysis, Methodology, Writing -review & editing. Jorge A. Calder ´ on: Conceptualization, Formal analysis, Funding acquisition, Methodology, Resources, Writing -review & editing. | H ´ ector D. Agudelo: Investigation, Methodology, Writing -original draft. Ferley A. V ´ asquez: Conceptualization, Formal analysis, Methodology, Writing -review & editing. Jorge A. Calder ´ on: Conceptualization, Formal analysis, Funding acquisition, Methodology, Resources, Writing -review & editing. | ||
| low | 13 | 174 | section_header | back_matter_heading | after_back_matter_stop | after_back_matter_stop | after_stop | p13:page_body:column_2_of_2:white | [255, 255, 255] white | [306.59, 589.31, 128.59, 7.31] | Declaration of competing interest | Declaration of competing interest | ||
| low | 13 | 176 | section_header | back_matter_heading | after_back_matter_stop | after_back_matter_stop | after_stop | p13:page_body:column_2_of_2:white | [255, 255, 255] white | [306.59, 652.4, 73.84, 7.31] | Acknowledgements | Acknowledgements | ||
| low | 13 | 177 | text | reference | after_back_matter_stop | after_back_matter_stop | after_stop | p13:bottom_margin:column_2_of_2:white | [255, 255, 255] white | [306.59, 673.32, 253.42, 70.07] | H. Agudelo expresses gratitude to the Faculty of Engineering at the Technological University of Choc ´ o for facilitating participation in the project and supporting the doctoral training program at the University of Antioquia. Appreciation is also extended to the Colombian Ministry of Science, Technology, and Innovation (Minciencias) for awarding the PhD Scholarship 1 of 2020 under the Bicentennial Excellence initiative. Additionally, sincere thanks are given to the project "Development of | H. Agudelo expresses gratitude to the Faculty of Engineering at the Technological University of Choc ´ o for facilitating participation in the project and supporting the doctoral training program at the University of Antioquia. Appreciation is also extended to the Colombian Ministry of Science, Technology, and Innovation (Minciencias) for awarding the PhD Scholarship 1 of 2020 under the Bicentennial Excellence initiative. Additionally, sincere thanks are given to the project "Development of | ||
| low | 13 | 178 | page_footer | page_footer | after_back_matter_stop | after_back_matter_stop | after_stop | p13:bottom_margin:column_2_of_2:white | [255, 255, 255] white | [294.42, 754.46, 7.18, 10.42] | 13 | 13 | ||
| low | 14 | 179 | page_header | page_header | after_back_matter_stop | after_back_matter_stop | after_stop | p14:top_margin:column_2_of_2:white | [255, 255, 255] white | [433.38, 33.66, 124.91, 10.42] | Journal of Power Sources 689 (2026) 240754 | Journal of Power Sources 689 (2026) 240754 | ||
| low | 14 | 180 | text | page_margin_header | after_back_matter_stop | after_back_matter_stop | after_stop | p14:top_margin:column_1_of_2:white | [255, 255, 255] white | [37.59, 37.0, 464.67, 5.85] | H.D. Agudelo et al. | H.D. Agudelo et al. | ||
| low | 14 | 181 | text | reference | after_back_matter_stop | after_back_matter_stop | after_stop | p14:top_margin:column_1_of_2:white | [255, 255, 255] white | [37.59, 55.48, 253.44, 90.99] | Scientific Capacities for Research on Infrastructure Deterioration Processes in Renewable Energy Systems in the Department of Choc ´ o" (BPIN: 2020000100330), carried out by the Technological University of Choc ´ o and the Center for Research in Renewable Energies and Climatology, for their technical guidance and support. The authors also thank the Colombian Ministry of Science, Technology, and Innovation, ' Minciencias, ' by the support provided through the Project 102596, Contract # 112721-392-2023 -PERSEO Program and the Project 1115-91491812, Contract # 119-2022. | Scientific Capacities for Research on Infrastructure Deterioration Processes in Renewable Energy Systems in the Department of Choc ´ o" (BPIN: 2020000100330), carried out by the Technological University of Choc ´ o and the Center for Research in Renewable Energies and Climatology, for their technical guidance and support. The authors also thank the Colombian Ministry of Science, Technology, and Innovation, ' Minciencias, ' by the support provided through the Project 102596, Contract # 112721-392-2023 -PERSEO Program and the Project 1115-91491812, Contract # 119-2022. | ||
| low | 14 | 182 | section_header | unknown_text | after_back_matter_stop | after_back_matter_stop | after_stop | p14:page_body:column_1_of_2:white | [255, 255, 255] white | [37.59, 160.7, 128.62, 7.31] | Appendix A. Supplementary data | Appendix A. Supplementary data | ||
| low | 14 | 183 | text | reference | after_back_matter_stop | after_back_matter_stop | after_stop | p14:page_body:column_1_of_2:white | [255, 255, 255] white | [37.59, 181.62, 253.41, 17.74] | Supplementary data to this article can be found online at https://doi. org/10.1016/j.jpowsour.2026.240754. | Supplementary data to this article can be found online at org/10.1016/j.jpowsour.2026.240754. | ||
| low | 14 | 184 | section_header | back_matter_heading | after_back_matter_stop | after_back_matter_stop | after_stop | p14:page_body:column_1_of_2:white | [255, 255, 255] white | [37.59, 213.03, 63.51, 7.31] | Data availability | Data availability | ||
| low | 14 | 185 | text | unknown_text | after_back_matter_stop | after_back_matter_stop | after_stop | p14:page_body:column_1_of_2:white | [255, 255, 255] white | [49.55, 233.95, 140.37, 7.31] | Data will be made available on request. | Data will be made available on request. | ||
| low | 14 | 186 | section_header | back_matter_heading | after_back_matter_stop | after_back_matter_stop | after_stop | p14:page_body:column_1_of_2:white | [255, 255, 255] white | [37.59, 255.44, 41.21, 7.31] | References | References | ||
| low | 14 | 187 | list_item | reference | after_back_matter_stop | after_back_matter_stop | after_stop | p14:page_body:column_1_of_2:white | [255, 255, 255] white | [40.99, 274.88, 247.57, 29.77] | Q. Zhou, Z. Liu, X. Qin, S. Tang, X. Luo, Atomic Fe -N4/P doped hierarchical porous carbon nanofiber flexible cloth for efficient Zn -air batteries in wide -range temperature, Carbon N. Y. 247 (2026) 121034, https://doi.org/10.1016/J. CARBON.2025.121034. | Q. Zhou, Z. Liu, X. Qin, S. Tang, X. Luo, Atomic Fe -N4/P doped hierarchical porous carbon nanofiber flexible cloth for efficient Zn -air batteries in wide -range temperature, Carbon N. Y. 247 (2026) 121034, | ||
| low | 14 | 188 | list_item | reference | after_back_matter_stop | after_back_matter_stop | after_stop | p14:page_body:column_1_of_2:white | [255, 255, 255] white | [40.99, 306.74, 247.57, 45.7] | B. Tang, Y. Zhang, B. Ji, G. Yu, Y. Zheng, X. Zhou, N. Kamonsutthipaijit, P. Buangam, S. Tunmee, H. Nakajima, U. Rittihong, Q. Pan, F. Zhang, Y. Tang, Ionmediated carbon microdomain engineering boosting enhanced Plateau capacity of carbon anode under high rate towards high-performance sodium dual-ion batteries, Nano-Micro Lett. 18 (1) (2026) 161, https://doi.org/10.1007/S40820025-02008-4, 2026 18. | B. Tang, Y. Zhang, B. Ji, G. Yu, Y. Zheng, X. Zhou, N. Kamonsutthipaijit, P. Buangam, S. Tunmee, H. Nakajima, U. Rittihong, Q. Pan, F. Zhang, Y. Tang, Ionmediated carbon microdomain engineering boosting enhanced Plateau capacity of carbon anode under high rate towards high-performance sodium dual-ion batteries, Nano-Micro Lett. 18 (1) (2026) 161, | ||
| low | 14 | 189 | list_item | reference | after_back_matter_stop | after_back_matter_stop | after_stop | p14:page_body:column_1_of_2:white | [255, 255, 255] white | [40.99, 354.59, 243.51, 37.71] | Y. Fan, X. Liu, J. Shang, B. Liu, X. Lei, H. Zong, Z. Peng, C. Jiang, Y. Tang, Interfacial phonon scattering enables ultrastable and high-power sodium-based dual-ion batteries with alloying anodes, Adv. Mater. 38 (2026) e72848, https:// doi.org/10.1002/ADMA.72848;REQUESTEDJOURNAL:JOURNAL:15214095; WGROUP:STRING:PUBLICATION. | Y. Fan, X. Liu, J. Shang, B. Liu, X. Lei, H. Zong, Z. Peng, C. Jiang, Y. Tang, Interfacial phonon scattering enables ultrastable and high-power sodium-based dual-ion batteries with alloying anodes, Adv. Mater. 38 (2026) e72848, https:// doi.org/10.1002/ADMA.72848;REQUESTEDJOURNAL:JOURNAL:15214095; WGROUP:STRING:PUBLICATION. | ||
| low | 14 | 190 | list_item | reference | after_back_matter_stop | after_back_matter_stop | after_stop | p14:page_body:column_1_of_2:white | [255, 255, 255] white | [40.99, 394.44, 235.57, 29.77] | H. Zhang, T. Liu, Y. Zhao, J. Hu, Q. Zuo, L. Jiang, From lithium to sodium: a comparative study of temperature and SOC dependence in second-order RC parameters for battery management migration, Energy 355 (2026) 141122, https://doi.org/10.1016/J.ENERGY.2026.141122. | H. Zhang, T. Liu, Y. Zhao, J. Hu, Q. Zuo, L. Jiang, From lithium to sodium: a comparative study of temperature and SOC dependence in second-order RC parameters for battery management migration, Energy 355 (2026) 141122, | ||
| low | 14 | 191 | list_item | reference | after_back_matter_stop | after_back_matter_stop | after_stop | p14:page_body:column_1_of_2:white | [255, 255, 255] white | [40.99, 426.3, 239.29, 21.78] | G. Xu, State-of-charge estimation method for lithium-ion batteries based on competitive SIR model, Front. Energy Res. 10 (2022) 984107, https://doi.org/ 10.3389/FENRG.2022.984107/TEXT. | G. Xu, State-of-charge estimation method for lithium-ion batteries based on competitive SIR model, Front. Energy Res. 10 (2022) 984107, 10.3389/FENRG.2022.984107/TEXT. | ||
| low | 14 | 192 | list_item | reference | after_back_matter_stop | after_back_matter_stop | after_stop | p14:page_body:column_1_of_2:white | [255, 255, 255] white | [40.99, 450.23, 247.57, 21.78] | D. Han, K. Park, J.H. Park, D.J. Yun, Y.H. Son, Selective doping of Li-rich layered oxide cathode materials for high-stability rechargeable Li-ion batteries, J. Ind. Eng. Chem. 68 (2018), https://doi.org/10.1016/j.jiec.2018.07.044. | D. Han, K. Park, J.H. Park, D.J. Yun, Y.H. Son, Selective doping of Li-rich layered oxide cathode materials for high-stability rechargeable Li-ion batteries, J. Ind. Eng. Chem. 68 (2018), | ||
| low | 14 | 193 | list_item | reference | after_back_matter_stop | after_back_matter_stop | after_stop | p14:page_body:column_1_of_2:white | [255, 255, 255] white | [40.99, 474.15, 247.55, 29.72] | C. Lu, S. Yang, H. Wu, Y. Zhang, X. Yang, T. Liang, Enhanced electrochemical performance of Li-rich Li1.2Mn0.52Co0.08Ni0.2O2 cathode materials for Li-ion batteries by vanadium doping, Electrochim. Acta 209 (2016) 448 -455, https://doi. org/10.1016/J.ELECTACTA.2016.05.119. | C. Lu, S. Yang, H. Wu, Y. Zhang, X. Yang, T. Liang, Enhanced electrochemical performance of Li-rich Li1.2Mn0.52Co0.08Ni0.2O2 cathode materials for Li-ion batteries by vanadium doping, Electrochim. Acta 209 (2016) 448 -455, org/10.1016/J.ELECTACTA.2016.05.119. | ||
| low | 14 | 194 | list_item | reference | after_back_matter_stop | after_back_matter_stop | after_stop | p14:page_body:column_1_of_2:white | [255, 255, 255] white | [40.99, 506.01, 247.57, 21.78] | H. Yu, H. Zhou, High-energy cathode materials (Li2MnO3 -LiMO2) for lithium-ion batteries, J. Phys. Chem. Lett. 4 (2013) 1268 -1280, https://doi.org/10.1021/ JZ400032V. | H. Yu, H. Zhou, High-energy cathode materials (Li2MnO3 -LiMO2) for lithium-ion batteries, J. Phys. Chem. Lett. 4 (2013) 1268 -1280, | ||
| low | 14 | 195 | list_item | reference | after_back_matter_stop | after_back_matter_stop | after_stop | p14:page_body:column_1_of_2:white | [255, 255, 255] white | [40.99, 529.94, 247.59, 29.72] | A. Shodiev, M. Chouchane, M. Gaberscek, O. Arcelus, J. Xu, H. Oularbi, J. Yu, J. Li, M. Morcrette, A.A. Franco, Deconvoluting the benefits of porosity distribution in layered electrodes on the electrochemical performance of Li-ion batteries, Energy Storage Mater. 47 (2022), https://doi.org/10.1016/j.ensm.2022.01.058. | A. Shodiev, M. Chouchane, M. Gaberscek, O. Arcelus, J. Xu, H. Oularbi, J. Yu, J. Li, M. Morcrette, A.A. Franco, Deconvoluting the benefits of porosity distribution in layered electrodes on the electrochemical performance of Li-ion batteries, Energy Storage Mater. 47 (2022), | ||
| low | 14 | 196 | list_item | reference | after_back_matter_stop | after_back_matter_stop | after_stop | p14:page_body:column_1_of_2:white | [255, 255, 255] white | [37.59, 561.8, 250.98, 29.77] | T. Liu, J. Liu, L. Li, L. Yu, J. Diao, T. Zhou, S. Li, A. Dai, W. Zhao, S. Xu, Y. Ren, L. Wang, T. Wu, R. Qi, Y. Xiao, J. Zheng, W. Cha, R. Harder, I. Robinson, J. Wen, J. Lu, F. Pan, K. Amine, Origin of structural degradation in Li-rich layered oxide cathode, Nature 606 (2022), https://doi.org/10.1038/s41586-022-04689-y. | T. Liu, J. Liu, L. Li, L. Yu, J. Diao, T. Zhou, S. Li, A. Dai, W. Zhao, S. Xu, Y. Ren, L. Wang, T. Wu, R. Qi, Y. Xiao, J. Zheng, W. Cha, R. Harder, I. Robinson, J. Wen, J. Lu, F. Pan, K. Amine, Origin of structural degradation in Li-rich layered oxide cathode, Nature 606 (2022), | ||
| low | 14 | 197 | list_item | reference | after_back_matter_stop | after_back_matter_stop | after_stop | p14:page_body:column_1_of_2:white | [255, 255, 255] white | [37.59, 593.66, 247.07, 21.84] | J. Zheng, Y. Ye, T. Liu, Y. Xiao, C. Wang, F. Wang, F. Pan, Ni/Li disordering in layered transition metal oxide: electrochemical impact, origin, and control, Acc. Chem. Res. 52 (2019), https://doi.org/10.1021/acs.accounts.9b00033. | J. Zheng, Y. Ye, T. Liu, Y. Xiao, C. Wang, F. Wang, F. Pan, Ni/Li disordering in layered transition metal oxide: electrochemical impact, origin, and control, Acc. Chem. Res. 52 (2019), | ||
| low | 14 | 198 | list_item | reference | after_back_matter_stop | after_back_matter_stop | after_stop | p14:page_body:column_1_of_2:white | [255, 255, 255] white | [37.59, 617.58, 248.36, 21.78] | Y.K. Sun, D.J. Lee, Y.J. Lee, Z. Chen, S.T. Myung, Cobalt-free nickel rich layered oxide cathodes for lithium-ion batteries, ACS Appl. Mater. Interfaces 5 (2013), https://doi.org/10.1021/am403684z. | Y.K. Sun, D.J. Lee, Y.J. Lee, Z. Chen, S.T. Myung, Cobalt-free nickel rich layered oxide cathodes for lithium-ion batteries, ACS Appl. Mater. Interfaces 5 (2013), | ||
| low | 14 | 199 | list_item | reference | after_back_matter_stop | after_back_matter_stop | after_stop | p14:page_body:column_1_of_2:white | [255, 255, 255] white | [37.59, 641.12, 250.97, 22.17] | H.D. Agudelo, F.A. Vasquez, J.A. Calder ´ on, Cobalt-free oxide cathode material with phase composition control to high electrochemical performance in Li-Ion batteries, J. Electrochem. Soc. 171 (2024), https://doi.org/10.1149/1945-7111/ad1c15. | H.D. Agudelo, F.A. Vasquez, J.A. Calder ´ on, Cobalt-free oxide cathode material with phase composition control to high electrochemical performance in Li-Ion batteries, J. Electrochem. Soc. 171 (2024), | ||
| low | 14 | 200 | list_item | reference | after_back_matter_stop | after_back_matter_stop | after_stop | p14:page_body:column_1_of_2:white | [255, 255, 255] white | [37.59, 665.43, 250.98, 37.71] | D. Eum, B. Kim, S.J. Kim, H. Park, J. Wu, S.P. Cho, G. Yoon, M.H. Lee, S.K. Jung, W. Yang, W.M. Seong, K. Ku, O. Tamwattana, S.K. Park, I. Hwang, K. Kang, Voltage decay and redox asymmetry mitigation by reversible cation migration in lithiumrich layered oxide electrodes, Nat. Mater. 19 (2020), https://doi.org/10.1038/ s41563-019-0572-4. | D. Eum, B. Kim, S.J. Kim, H. Park, J. Wu, S.P. Cho, G. Yoon, M.H. Lee, S.K. Jung, W. Yang, W.M. Seong, K. Ku, O. Tamwattana, S.K. Park, I. Hwang, K. Kang, Voltage decay and redox asymmetry mitigation by reversible cation migration in lithiumrich layered oxide electrodes, Nat. Mater. 19 (2020), | ||
| low | 14 | 201 | list_item | reference | after_back_matter_stop | after_back_matter_stop | after_stop | p14:bottom_margin:column_1_of_2:white | [255, 255, 255] white | [37.59, 705.29, 250.96, 37.71] | R.N. Ramesha, D. Bosubabu, M.G. Karthick Babu, K. Ramesha, Erratum: tuning of Ni, Mn, and Co (NMC) content in 0.4(LiNixMnyCozO2) ⋅ 0.4(Li2MnO3) toward stable high-capacity lithium-rich cathode materials, ACS Appl. Energy Mater. 11 (3) (2020) 10872 -10881, https://doi.org/10.1021/acsaem.0c03256, 10.1021/ acsaem.0c01897), ACS Appl. Energy Mater. 4 (2021). | R.N. Ramesha, D. Bosubabu, M.G. Karthick Babu, K. Ramesha, Erratum: tuning of Ni, Mn, and Co (NMC) content in 0.4(LiNixMnyCozO2) ⋅ 0.4(Li2MnO3) toward stable high-capacity lithium-rich cathode materials, ACS Appl. Energy Mater. 11 (3) (2020) 10872 -10881, | ||
| low | 14 | 202 | list_item | reference | after_back_matter_stop | after_back_matter_stop | after_stop | p14:top_margin:column_2_of_2:white | [255, 255, 255] white | [306.59, 55.48, 250.97, 21.78] | J. Li, G. Liang, W. Zheng, S. Zhang, K. Davey, W.K. Pang, Z. Guo, Addressing cation mixing in layered structured cathodes for lithium-ion batteries: a critical review, Nano Mater. Sci. (2022), https://doi.org/10.1016/j.nanoms.2022.09.001. | J. Li, G. Liang, W. Zheng, S. Zhang, K. Davey, W.K. Pang, Z. Guo, Addressing cation mixing in layered structured cathodes for lithium-ion batteries: a critical review, Nano Mater. Sci. (2022), | ||
| low | 14 | 203 | list_item | reference | after_back_matter_stop | after_back_matter_stop | after_stop | p14:page_body:column_2_of_2:white | [255, 255, 255] white | [306.59, 79.4, 250.93, 29.77] | R.N. Ramesha, D. Bosubabu, M.G. Karthick Babu, K. Ramesha, Tuning of Ni, Mn, and Co (NMC) content in 0.4(LiNixMnyCozo2) ⋅ 0.4(Li2MnO3) toward stable highcapacity lithium-rich cathode materials, ACS Appl. Energy Mater. 3 (2020), https://doi.org/10.1021/acsaem.0c01897. | R.N. Ramesha, D. Bosubabu, M.G. Karthick Babu, K. Ramesha, Tuning of Ni, Mn, and Co (NMC) content in 0.4(LiNixMnyCozo2) ⋅ 0.4(Li2MnO3) toward stable highcapacity lithium-rich cathode materials, ACS Appl. Energy Mater. 3 (2020), | ||
| low | 14 | 204 | list_item | reference | after_back_matter_stop | after_back_matter_stop | after_stop | p14:page_body:column_2_of_2:white | [255, 255, 255] white | [306.59, 111.26, 250.96, 29.77] | Z. Zlatanova, D. Marinova, R. Kukeva, L. Mihaylov, D. Nihtianova, R. Stoyanova, Layered manganese oxide Mn5O8 as a structural matrix for fast lithium and magnesium intercalation, J. Alloys Compd. 851 (2021), https://doi.org/10.1016/j. jallcom.2020.156706. | Z. Zlatanova, D. Marinova, R. Kukeva, L. Mihaylov, D. Nihtianova, R. Stoyanova, Layered manganese oxide Mn5O8 as a structural matrix for fast lithium and magnesium intercalation, J. Alloys Compd. 851 (2021), | ||
| low | 14 | 205 | list_item | reference | after_back_matter_stop | after_back_matter_stop | after_stop | p14:page_body:column_2_of_2:white | [255, 255, 255] white | [306.59, 143.18, 250.93, 21.78] | Z. Kai, W. Yang, Z. Shuang, Y. Yan, P. Hao, L. Guiwei, J. Jianli, Synthesis of single crystalline spinel LiMn2O4 nanorods for a lithium ion battery, Int. J. Electrochem. Sci. 9 (2014), https://doi.org/10.1016/s1452-3981(23)08166-x. | Z. Kai, W. Yang, Z. Shuang, Y. Yan, P. Hao, L. Guiwei, J. Jianli, Synthesis of single crystalline spinel LiMn2O4 nanorods for a lithium ion battery, Int. J. Electrochem. Sci. 9 (2014), | ||
| low | 14 | 206 | list_item | reference | after_back_matter_stop | after_back_matter_stop | after_stop | p14:page_body:column_2_of_2:white | [255, 255, 255] white | [306.59, 167.05, 239.8, 21.78] | J. Zhang, J. Qiao, K. Sun, Z. Wang, Balancing particle properties for practical lithium-ion batteries, Particuology 61 (2022), https://doi.org/10.1016/j. partic.2021.05.006. | J. Zhang, J. Qiao, K. Sun, Z. Wang, Balancing particle properties for practical lithium-ion batteries, Particuology 61 (2022), | ||
| low | 14 | 207 | list_item | reference | after_back_matter_stop | after_back_matter_stop | after_stop | p14:page_body:column_2_of_2:white | [255, 255, 255] white | [306.59, 190.97, 249.11, 29.77] | G. Chen, J. An, Y. Meng, C. Yuan, B. Matthews, F. Dou, L. Shi, Y. Zhou, P. Song, G. Wu, D. Zhang, Cation and anion Co-doping synergy to improve structural stability of Li- and Mn-rich layered cathode materials for lithium-ion batteries, Nano Energy 57 (2019), https://doi.org/10.1016/j.nanoen.2018.12.049. | G. Chen, J. An, Y. Meng, C. Yuan, B. Matthews, F. Dou, L. Shi, Y. Zhou, P. Song, G. Wu, D. Zhang, Cation and anion Co-doping synergy to improve structural stability of Li- and Mn-rich layered cathode materials for lithium-ion batteries, Nano Energy 57 (2019), | ||
| low | 14 | 208 | list_item | reference | after_back_matter_stop | after_back_matter_stop | after_stop | p14:page_body:column_2_of_2:white | [255, 255, 255] white | [306.59, 222.83, 248.01, 21.84] | N.H. Kwon, J. Conder, M. Srout, K.M. Fromm, Surface modifications of positiveelectrode materials for lithium ion batteries, Chimia 73 (2019), https://doi.org/ 10.2533/chimia.2019.880. | N.H. Kwon, J. Conder, M. Srout, K.M. Fromm, Surface modifications of positiveelectrode materials for lithium ion batteries, Chimia 73 (2019), 10.2533/chimia.2019.880. | ||
| low | 14 | 209 | list_item | reference | after_back_matter_stop | after_back_matter_stop | after_stop | p14:page_body:column_2_of_2:white | [255, 255, 255] white | [306.59, 246.76, 250.96, 29.77] | H. Meng, L. Li, J. Liu, X. Han, W. Zhang, X. Liu, Q. Xu, Surface modification of Lirich layered Li[Li0.17Ni0.17Co0.10Mn0.56]O2oxide with LiV3O8as a cathode material for Li-ion batteries, J. Alloys Compd. 690 (2017), https://doi.org/ 10.1016/j.jallcom.2016.08.089. | H. Meng, L. Li, J. Liu, X. Han, W. Zhang, X. Liu, Q. Xu, Surface modification of Lirich layered Li[Li0.17Ni0.17Co0.10Mn0.56]O2oxide with LiV3O8as a cathode material for Li-ion batteries, J. Alloys Compd. 690 (2017), 10.1016/j.jallcom.2016.08.089. | ||
| low | 14 | 210 | list_item | reference | after_back_matter_stop | after_back_matter_stop | after_stop | p14:page_body:column_2_of_2:white | [255, 255, 255] white | [306.59, 278.62, 250.95, 21.84] | D. Wang, T. Xu, Y. Li, D. Pan, X. Lu, Y.S. Hu, S. Dai, Y. Bai, Integrated surface functionalization of Li-Rich cathode materials for Li-Ion batteries, ACS Appl. Mater. Interfaces 10 (2018), https://doi.org/10.1021/acsami.8b16319. | D. Wang, T. Xu, Y. Li, D. Pan, X. Lu, Y.S. Hu, S. Dai, Y. Bai, Integrated surface functionalization of Li-Rich cathode materials for Li-Ion batteries, ACS Appl. Mater. Interfaces 10 (2018), | ||
| low | 14 | 211 | list_item | reference | after_back_matter_stop | after_back_matter_stop | after_stop | p14:page_body:column_2_of_2:white | [255, 255, 255] white | [306.59, 302.54, 250.96, 29.77] | P. Yang, H. Li, X. Wei, S. Zhang, Y. Xing, Structure tuned Li1.2Mn0.6Ni0.2O2 with low cation mixing and Ni segregation as high performance cathode materials for Liion batteries, Electrochim. Acta 271 (2018) 276 -283, https://doi.org/10.1016/J. ELECTACTA.2018.01.104. | P. Yang, H. Li, X. Wei, S. Zhang, Y. Xing, Structure tuned Li1.2Mn0.6Ni0.2O2 with low cation mixing and Ni segregation as high performance cathode materials for Liion batteries, Electrochim. Acta 271 (2018) 276 -283, | ||
| low | 14 | 212 | list_item | reference | after_back_matter_stop | after_back_matter_stop | after_stop | p14:page_body:column_2_of_2:white | [255, 255, 255] white | [306.59, 334.46, 250.93, 29.72] | G. Hu, X. Qi, K. Hu, X. Lai, X. Zhang, K. Du, Z. Peng, Y. Cao, A facile cathode design with a LiNi0.6Co0.2Mn0.2O2 core and an AlF3-activated Li1.2Ni0.2Mn0.6O2 shell for Li-ion batteries, Electrochim. Acta 265 (2018) 391 -399, https://doi.org/ 10.1016/j.electacta.2018.01.176. | G. Hu, X. Qi, K. Hu, X. Lai, X. Zhang, K. Du, Z. Peng, Y. Cao, A facile cathode design with a LiNi0.6Co0.2Mn0.2O2 core and an AlF3-activated Li1.2Ni0.2Mn0.6O2 shell for Li-ion batteries, Electrochim. Acta 265 (2018) 391 -399, 10.1016/j.electacta.2018.01.176. | ||
| low | 14 | 213 | list_item | reference | after_back_matter_stop | after_back_matter_stop | after_stop | p14:page_body:column_2_of_2:white | [255, 255, 255] white | [306.59, 366.32, 250.92, 29.77] | X. Ding, L.N. Xiao, Y.X. Li, Z.F. Tang, J.W. Wan, Z.Y. Wen, C.H. Chen, Improving the electrochemical performance of Li-rich Li1.2Ni0.2Mn0.6O2 by using Ni-Mn oxide surface modification, J. Power Sources 390 (2018) 13 -19, https://doi.org/ 10.1016/J.JPOWSOUR.2018.04.034. | X. Ding, L.N. Xiao, Y.X. Li, Z.F. Tang, J.W. Wan, Z.Y. Wen, C.H. Chen, Improving the electrochemical performance of Li-rich Li1.2Ni0.2Mn0.6O2 by using Ni-Mn oxide surface modification, J. Power Sources 390 (2018) 13 -19, 10.1016/J.JPOWSOUR.2018.04.034. | ||
| low | 14 | 214 | list_item | reference | after_back_matter_stop | after_back_matter_stop | after_stop | p14:page_body:column_2_of_2:white | [255, 255, 255] white | [306.59, 398.18, 250.11, 29.77] | Y. Huang, X. Hou, X. Fan, S. Ma, S. Hu, K.H. Lam, Advanced Li-Rich cathode collaborated with graphite/silicon anode for high performance Li-Ion batteries in half and full cells, Electrochim. Acta 182 (2015), https://doi.org/10.1016/j. electacta.2015.09.067. | Y. Huang, X. Hou, X. Fan, S. Ma, S. Hu, K.H. Lam, Advanced Li-Rich cathode collaborated with graphite/silicon anode for high performance Li-Ion batteries in half and full cells, Electrochim. Acta 182 (2015), | ||
| low | 14 | 215 | list_item | reference | after_back_matter_stop | after_back_matter_stop | after_stop | p14:page_body:column_2_of_2:white | [255, 255, 255] white | [306.59, 429.65, 249.46, 30.16] | F.A. V ´ asquez, J.E. Thomas, A. Visintin, J.A. Calder ´ on, LiMn1.8Ni0.2O4 nanorods obtained from a novel route using α -MnOOH precursor as cathode material for lithium-ion batteries, Solid State Ion 320 (2018) 339 -346, https://doi.org/ 10.1016/j.ssi.2018.03.013. | F.A. V ´ asquez, J.E. Thomas, A. Visintin, J.A. Calder ´ on, LiMn1.8Ni0.2O4 nanorods obtained from a novel route using α -MnOOH precursor as cathode material for lithium-ion batteries, Solid State Ion 320 (2018) 339 -346, 10.1016/j.ssi.2018.03.013. | ||
| low | 14 | 216 | list_item | reference | after_back_matter_stop | after_back_matter_stop | after_stop | p14:page_body:column_2_of_2:white | [255, 255, 255] white | [306.6, 461.96, 240.83, 29.77] | Q. Ma, F. Peng, R. Li, S. Yin, C. Dai, Effect of calcination temperature on microstructure and electrochemical performance of lithium-rich layered oxide cathode materials, Mater. Sci. Eng., B 213 (2016) 123 -130, https://doi.org/ 10.1016/J.MSEB.2016.04.010. | Q. Ma, F. Peng, R. Li, S. Yin, C. Dai, Effect of calcination temperature on microstructure and electrochemical performance of lithium-rich layered oxide cathode materials, Mater. Sci. Eng., B 213 (2016) 123 -130, 10.1016/J.MSEB.2016.04.010. | ||
| low | 14 | 217 | list_item | reference | after_back_matter_stop | after_back_matter_stop | after_stop | p14:page_body:column_2_of_2:white | [255, 255, 255] white | [306.6, 493.82, 235.01, 29.77] | Y.H. Jouybari, S. Asgari, Synthesis and electrochemical properties of LiNi0.8Co0.2O2 nanopowders for lithium ion battery applications, J. Power Sources 196 (2011) 337 -342, https://doi.org/10.1016/J. JPOWSOUR.2010.06.097. | Y.H. Jouybari, S. Asgari, Synthesis and electrochemical properties of LiNi0.8Co0.2O2 nanopowders for lithium ion battery applications, J. Power Sources 196 (2011) 337 -342, | ||
| low | 14 | 218 | list_item | reference | after_back_matter_stop | after_back_matter_stop | after_stop | p14:page_body:column_2_of_2:white | [255, 255, 255] white | [306.6, 525.74, 250.95, 29.72] | A.T.S. Freiberg, J. Sicklinger, S. Solchenbach, H.A. Gasteiger, Li2CO3 decomposition in Li-ion batteries induced by the electrochemical oxidation of the electrolyte and of electrolyte impurities, Electrochim. Acta 346 (2020), https://doi. org/10.1016/j.electacta.2020.136271. | A.T.S. Freiberg, J. Sicklinger, S. Solchenbach, H.A. Gasteiger, Li2CO3 decomposition in Li-ion batteries induced by the electrochemical oxidation of the electrolyte and of electrolyte impurities, Electrochim. Acta 346 (2020), org/10.1016/j.electacta.2020.136271. | ||
| low | 14 | 219 | list_item | reference | after_back_matter_stop | after_back_matter_stop | after_stop | p14:page_body:column_2_of_2:white | [255, 255, 255] white | [306.6, 557.6, 246.04, 21.78] | T. Tang, H.L. Zhang, Synthesis and electrochemical performance of lithium-rich cathode material Li[Li0.2Ni0.15Mn0.55Co0.1-xAlx]O2, Electrochim. Acta 191 (2016), https://doi.org/10.1016/j.electacta.2016.01.066. | T. Tang, H.L. Zhang, Synthesis and electrochemical performance of lithium-rich cathode material Li[Li0.2Ni0.15Mn0.55Co0.1-xAlx]O2, Electrochim. Acta 191 (2016), | ||
| low | 14 | 220 | list_item | reference | after_back_matter_stop | after_back_matter_stop | after_stop | p14:page_body:column_2_of_2:white | [255, 255, 255] white | [306.6, 581.53, 248.57, 29.72] | Y. Chen, S. Luo, J. Leng, S. Deng, S. Yan, X. Tian, Y. Li, J. Guo, T. Lei, J. Zheng, Exploring the synthesis conditions and formation mechanisms of Li-rich layered oxides via solid-state method, J. Alloys Compd. 854 (2021), https://doi.org/ 10.1016/j.jallcom.2020.157204. | Y. Chen, S. Luo, J. Leng, S. Deng, S. Yan, X. Tian, Y. Li, J. Guo, T. Lei, J. Zheng, Exploring the synthesis conditions and formation mechanisms of Li-rich layered oxides via solid-state method, J. Alloys Compd. 854 (2021), 10.1016/j.jallcom.2020.157204. | ||
| low | 14 | 221 | list_item | reference | after_back_matter_stop | after_back_matter_stop | after_stop | p14:page_body:column_2_of_2:white | [255, 255, 255] white | [306.6, 613.39, 250.95, 29.77] | A.M. Pillai, P.S. Salini, B. John, C. Suchithra, S. SarojiniAmma, M.T. Devassy, Lithium-rich Li1.17Ni0.17Co0.17Mn0.5O2 cathode material for lithium-ion cells: effect of calcination temperature on electrochemical performance, Energy Fuels 37 (2023), https://doi.org/10.1021/acs.energyfuels.3c02174. | A.M. Pillai, P.S. Salini, B. John, C. Suchithra, S. SarojiniAmma, M.T. Devassy, Lithium-rich Li1.17Ni0.17Co0.17Mn0.5O2 cathode material for lithium-ion cells: effect of calcination temperature on electrochemical performance, Energy Fuels 37 (2023), | ||
| low | 14 | 222 | list_item | reference | after_back_matter_stop | after_back_matter_stop | after_stop | p14:page_body:column_2_of_2:white | [255, 255, 255] white | [306.6, 645.25, 250.93, 29.77] | Z. Wu, Y.H. Zhang, H. Wang, Z. Liu, X. Zhang, X. Dai, K. Zou, X. Lou, X. Hu, L. Ma, Y. Liu, Y. Liu, Cooperative structure of Li/Ni mixing and stacking faults for achieving high-capacity Co-free Li-rich oxides, J. Energy Chem. 95 (2024) 315 -324, https://doi.org/10.1016/J.JECHEM.2024.03.050. | Z. Wu, Y.H. Zhang, H. Wang, Z. Liu, X. Zhang, X. Dai, K. Zou, X. Lou, X. Hu, L. Ma, Y. Liu, Y. Liu, Cooperative structure of Li/Ni mixing and stacking faults for achieving high-capacity Co-free Li-rich oxides, J. Energy Chem. 95 (2024) 315 -324, | ||
| low | 14 | 223 | list_item | reference | after_back_matter_stop | after_back_matter_stop | after_stop | p14:page_body:column_2_of_2:white | [255, 255, 255] white | [306.6, 677.17, 250.57, 21.78] | C.P. Laisa, R.N. Ramesha, K. Ramesha, Enhanced electrochemical performance of lithium rich layered cathode materials by Ca2 + substitution, Electrochim. Acta 256 (2017), https://doi.org/10.1016/j.electacta.2017.10.029. | C.P. Laisa, R.N. Ramesha, K. Ramesha, Enhanced electrochemical performance of lithium rich layered cathode materials by Ca2 + substitution, Electrochim. Acta 256 (2017), | ||
| low | 14 | 224 | list_item | reference | after_back_matter_stop | after_back_matter_stop | after_stop | p14:bottom_margin:column_2_of_2:white | [255, 255, 255] white | [306.6, 701.03, 250.26, 29.78] | T. Kohler, T. Armbruster, E. Libowitzky, Hydrogen bonding and jahn-teller distortion in Groutite, α -MnOOH, and Manganite, γ -MnOOH, and their relations to the manganese dioxides ramsdellite and pyrolusite, J. Solid State Chem. 133 (1997), https://doi.org/10.1006/jssc.1997.7516. | T. Kohler, T. Armbruster, E. Libowitzky, Hydrogen bonding and jahn-teller distortion in Groutite, α -MnOOH, and Manganite, γ -MnOOH, and their relations to the manganese dioxides ramsdellite and pyrolusite, J. Solid State Chem. 133 (1997), | ||
| low | 14 | 225 | page_footer | page_footer | after_back_matter_stop | after_back_matter_stop | after_stop | p14:bottom_margin:column_2_of_2:white | [255, 255, 255] white | [294.42, 754.46, 7.18, 10.42] | 14 | 14 | ||
| low | 15 | 226 | page_header | page_header | after_back_matter_stop | after_back_matter_stop | after_stop | p15:top_margin:column_2_of_2:white | [255, 255, 255] white | [433.38, 33.66, 124.91, 10.42] | Journal of Power Sources 689 (2026) 240754 | Journal of Power Sources 689 (2026) 240754 | ||
| low | 15 | 227 | text | page_margin_header | after_back_matter_stop | after_back_matter_stop | after_stop | p15:top_margin:column_1_of_2:white | [255, 255, 255] white | [37.59, 37.0, 464.67, 5.85] | H.D. Agudelo et al. | H.D. Agudelo et al. | ||
| low | 15 | 228 | list_item | reference | after_back_matter_stop | after_back_matter_stop | after_stop | p15:top_margin:column_1_of_2:white | [255, 255, 255] white | [37.59, 55.48, 250.98, 21.78] | L. Lan, Q. Li, G. Gu, H. Zhang, B. Liu, Hydrothermal synthesis of γ -MnOOH nanorods and their conversion to MnO2, Mn2O3, and Mn3O4 nanorods, J. Alloys Compd. 644 (2015), https://doi.org/10.1016/j.jallcom.2015.05.078. | L. Lan, Q. Li, G. Gu, H. Zhang, B. Liu, Hydrothermal synthesis of γ -MnOOH nanorods and their conversion to MnO2, Mn2O3, and Mn3O4 nanorods, J. Alloys Compd. 644 (2015), | ||
| low | 15 | 229 | list_item | reference | after_back_matter_stop | after_back_matter_stop | after_stop | p15:page_body:column_1_of_2:white | [255, 255, 255] white | [37.59, 79.01, 250.96, 30.16] | E. Flores, P. Nov ´ ak, U. Aschauer, E.J. Berg, Cation ordering and redox chemistry of layered Ni-Rich LixNi1 -2yCoyMnyO2: an operando raman spectroscopy study, Chem. Mater. 32 (2019) 186 -194, https://doi.org/10.1021/ACS. CHEMMATER.9B03202. | E. Flores, P. Nov ´ ak, U. Aschauer, E.J. Berg, Cation ordering and redox chemistry of layered Ni-Rich LixNi1 -2yCoyMnyO2: an operando raman spectroscopy study, Chem. Mater. 32 (2019) 186 -194, | ||
| low | 15 | 230 | list_item | reference | after_back_matter_stop | after_back_matter_stop | after_stop | p15:page_body:column_1_of_2:white | [255, 255, 255] white | [37.59, 111.26, 236.78, 13.84] | P. Kalyani, N. Kalaiselvi, Various aspects of LiNiO2 chemistry: a review, Sci. Technol. Adv. Mater. 6 (2005), https://doi.org/10.1016/j.stam.2005.06.001. | P. Kalyani, N. Kalaiselvi, Various aspects of LiNiO2 chemistry: a review, Sci. Technol. Adv. Mater. 6 (2005), | ||
| low | 15 | 231 | list_item | reference | after_back_matter_stop | after_back_matter_stop | after_stop | p15:page_body:column_1_of_2:white | [255, 255, 255] white | [37.59, 127.19, 247.57, 29.77] | Y. Jin, W. He, F. Ren, P. Ren, Y. Xu, High-performance symmetric lithium-ion batteries constructed with a new bi-functional electrode Li- and Mn-rich layered oxide 0.3Li2MnO3 ⋅ 0.7LiNi1/3Co1/3Mn1/3O2, Electrochim. Acta 325 (2019), https://doi.org/10.1016/j.electacta.2019.134932. | Y. Jin, W. He, F. Ren, P. Ren, Y. Xu, High-performance symmetric lithium-ion batteries constructed with a new bi-functional electrode Li- and Mn-rich layered oxide 0.3Li2MnO3 ⋅ 0.7LiNi1/3Co1/3Mn1/3O2, Electrochim. Acta 325 (2019), | ||
| low | 15 | 232 | list_item | reference | after_back_matter_stop | after_back_matter_stop | after_stop | p15:page_body:column_1_of_2:white | [255, 255, 255] white | [37.59, 159.11, 248.55, 29.72] | Z. Wu, K. Zou, X. Dai, Y.H. Zhang, X. Zhang, H. Wang, Z. Hou, L. Ma, Y. Liu, Y. Chen, S. Guo, Y. Liu, High-capacity high-Ni low-Co Li-rich layered oxides via adjusting Li2MnO3 content and Li/Ni mixing defects, Chem. Eng. J. 474 (2023), https://doi.org/10.1016/j.cej.2023.145986. | Z. Wu, K. Zou, X. Dai, Y.H. Zhang, X. Zhang, H. Wang, Z. Hou, L. Ma, Y. Liu, Y. Chen, S. Guo, Y. Liu, High-capacity high-Ni low-Co Li-rich layered oxides via adjusting Li2MnO3 content and Li/Ni mixing defects, Chem. Eng. J. 474 (2023), | ||
| low | 15 | 233 | list_item | reference | after_back_matter_stop | after_back_matter_stop | after_stop | p15:page_body:column_1_of_2:white | [255, 255, 255] white | [37.59, 190.97, 250.96, 29.77] | E.V. Makhonina, L.S. Maslennikova, V.V. Volkov, A.E. Medvedeva, A. M. Rumyantsev, Y.M. Koshtyal, M.Y. Maximov, V.S. Pervov, I.L. Eremenko, Li-rich and Ni-rich transition metal oxides: coating and core-shell structures, Appl. Surf. Sci. 474 (2019), https://doi.org/10.1016/j.apsusc.2018.07.159. | E.V. Makhonina, L.S. Maslennikova, V.V. Volkov, A.E. Medvedeva, A. M. Rumyantsev, Y.M. Koshtyal, M.Y. Maximov, V.S. Pervov, I.L. Eremenko, Li-rich and Ni-rich transition metal oxides: coating and core-shell structures, Appl. Surf. Sci. 474 (2019), | ||
| low | 15 | 234 | list_item | reference | after_back_matter_stop | after_back_matter_stop | after_stop | p15:page_body:column_1_of_2:white | [255, 255, 255] white | [37.59, 222.83, 250.96, 21.84] | C. Zhao, X. Wang, R. Liu, F. Xu, Q. Shen, β -MnO2 sacrificial template synthesis of Li 1.2Ni0.13Co0.13Mn0.54O2 for lithium ion battery cathodes, RSC Adv. 4 (2014) 7154 -7159, https://doi.org/10.1039/c3ra45428b. | C. Zhao, X. Wang, R. Liu, F. Xu, Q. Shen, β -MnO2 sacrificial template synthesis of Li 1.2Ni0.13Co0.13Mn0.54O2 for lithium ion battery cathodes, RSC Adv. 4 (2014) 7154 -7159, | ||
| low | 15 | 235 | list_item | reference | after_back_matter_stop | after_back_matter_stop | after_stop | p15:page_body:column_1_of_2:white | [255, 255, 255] white | [37.59, 246.76, 250.97, 29.77] | H. Guan, Y. Yang, H. Luo, H. Chen, H. Zhou, Improved electrochemical performance of a Li 1.2 Ni 0.2 Mn 0.6 O 2 cathode by a hydrothermal method with a metal -organic framework as a precursor, ACS Appl. Energy Mater. 4 (2021) 2506 -2513, https://doi.org/10.1021/acsaem.0c03020. | H. Guan, Y. Yang, H. Luo, H. Chen, H. Zhou, Improved electrochemical performance of a Li 1.2 Ni 0.2 Mn 0.6 O 2 cathode by a hydrothermal method with a metal -organic framework as a precursor, ACS Appl. Energy Mater. 4 (2021) 2506 -2513, | ||
| low | 15 | 236 | list_item | reference | after_back_matter_stop | after_back_matter_stop | after_stop | p15:page_body:column_1_of_2:white | [255, 255, 255] white | [37.59, 278.62, 250.98, 29.77] | C.X. Zhou, P.B. Wang, B. Zhang, L.B. Tang, H. Tong, Z.J. He, J.C. Zheng, Formation and effect of residual lithium compounds on Li-Rich cathode material Li 1.35 [Ni 0.35 Mn 0.65 ]O 2, ACS Appl. Mater. Interfaces 11 (2019), https://doi.org/ 10.1021/acsami.9b01806. | C.X. Zhou, P.B. Wang, B. Zhang, L.B. Tang, H. Tong, Z.J. He, J.C. Zheng, Formation and effect of residual lithium compounds on Li-Rich cathode material Li 1.35 [Ni 0.35 Mn 0.65 ]O 2, ACS Appl. Mater. Interfaces 11 (2019), 10.1021/acsami.9b01806. | ||
| low | 15 | 237 | list_item | reference | after_back_matter_stop | after_back_matter_stop | after_stop | p15:page_body:column_1_of_2:white | [255, 255, 255] white | [37.59, 310.54, 234.04, 21.78] | S. Liu, B. Wang, X. Zhang, S. Zhao, Z. Zhang, H. Yu, Reviving the lithiummanganese-based layered oxide cathodes for lithium-ion batteries, Matter 4 (2021), https://doi.org/10.1016/j.matt.2021.02.023. | S. Liu, B. Wang, X. Zhang, S. Zhao, Z. Zhang, H. Yu, Reviving the lithiummanganese-based layered oxide cathodes for lithium-ion batteries, Matter 4 (2021), | ||
| low | 15 | 238 | list_item | reference | after_back_matter_stop | after_back_matter_stop | after_stop | p15:page_body:column_1_of_2:white | [255, 255, 255] white | [37.59, 334.46, 250.96, 29.72] | A. Abouimrane, O.C. Compton, H. Deng, I. Belharouak, D.A. Dikin, S.T. Nguyen, K. Amine, Improved rate capability in a high-capacity layered cathode material via thermal reduction, Electrochem. Solid State Lett. 14 (2011), https://doi.org/ 10.1149/1.3597655. | A. Abouimrane, O.C. Compton, H. Deng, I. Belharouak, D.A. Dikin, S.T. Nguyen, K. Amine, Improved rate capability in a high-capacity layered cathode material via thermal reduction, Electrochem. Solid State Lett. 14 (2011), 10.1149/1.3597655. | ||
| low | 15 | 239 | list_item | reference | after_back_matter_stop | after_back_matter_stop | after_stop | p15:page_body:column_1_of_2:white | [255, 255, 255] white | [37.59, 366.32, 248.31, 21.78] | K.M. Shaju, G.V. Subba Rao, B.V.R. Chowdari, X-ray photoelectron spectroscopy and electrochemical behaviour of 4 V cathode, Li(Ni1/2Mn1/2)O2, Electrochim. Acta 48 (2003), https://doi.org/10.1016/S0013-4686(03)00088-4. | K.M. Shaju, G.V. Subba Rao, B.V.R. Chowdari, X-ray photoelectron spectroscopy and electrochemical behaviour of 4 V cathode, Li(Ni1/2Mn1/2)O2, Electrochim. Acta 48 (2003), | ||
| low | 15 | 240 | list_item | reference | after_back_matter_stop | after_back_matter_stop | after_stop | p15:top_margin:column_2_of_2:white | [255, 255, 255] white | [306.59, 55.48, 250.96, 29.77] | Y. Pei, Q. Chen, Y.C. Xiao, L. Liu, C.Y. Xu, L. Zhen, G. Henkelman, G. Cao, Understanding the phase transitions in spinel-layered-rock salt system: criterion for the rational design of LLO/spinel nanocomposites, Nano Energy 40 (2017), https://doi.org/10.1016/j.nanoen.2017.08.054. | Y. Pei, Q. Chen, Y.C. Xiao, L. Liu, C.Y. Xu, L. Zhen, G. Henkelman, G. Cao, Understanding the phase transitions in spinel-layered-rock salt system: criterion for the rational design of LLO/spinel nanocomposites, Nano Energy 40 (2017), | ||
| low | 15 | 241 | list_item | reference | after_back_matter_stop | after_back_matter_stop | after_stop | p15:page_body:column_2_of_2:white | [255, 255, 255] white | [306.59, 87.34, 250.92, 29.77] | M.C. Biesinger, B.P. Payne, A.P. Grosvenor, L.W.M. Lau, A.R. Gerson, R.S.C. Smart, Resolving surface chemical states in XPS analysis of first row transition metals, oxides and hydroxides: cr, Mn, Fe, Co and Ni, Appl. Surf. Sci. 257 (2011) 2717 -2730, https://doi.org/10.1016/J.APSUSC.2010.10.051. | M.C. Biesinger, B.P. Payne, A.P. Grosvenor, L.W.M. Lau, A.R. Gerson, R.S.C. Smart, Resolving surface chemical states in XPS analysis of first row transition metals, oxides and hydroxides: cr, Mn, Fe, Co and Ni, Appl. Surf. Sci. 257 (2011) 2717 -2730, | ||
| low | 15 | 242 | list_item | reference | after_back_matter_stop | after_back_matter_stop | after_stop | p15:page_body:column_2_of_2:white | [255, 255, 255] white | [306.59, 119.26, 248.7, 29.77] | X. Ding, D. Luo, J. Cui, H. Xie, Q. Ren, Z. Lin, An ultra-long-life lithium-rich Li1.2Mn0.6Ni0.2O2 cathode by three-in-one surface modification for lithium-ion batteries, Angew. Chem. Int. Ed. 59 (2020), https://doi.org/10.1002/ anie.202000628. | X. Ding, D. Luo, J. Cui, H. Xie, Q. Ren, Z. Lin, An ultra-long-life lithium-rich Li1.2Mn0.6Ni0.2O2 cathode by three-in-one surface modification for lithium-ion batteries, Angew. Chem. Int. Ed. 59 (2020), | ||
| low | 15 | 243 | list_item | reference | after_back_matter_stop | after_back_matter_stop | after_stop | p15:page_body:column_2_of_2:white | [255, 255, 255] white | [306.59, 151.12, 236.71, 21.78] | J.L. Junta, M.F. Hochella, Manganese (II) oxidation at mineral surfaces: a microscopic and spectroscopic study, Geochim. Cosmochim. Acta 58 (1994), https://doi.org/10.1016/0016-7037(94)90226-7. | J.L. Junta, M.F. Hochella, Manganese (II) oxidation at mineral surfaces: a microscopic and spectroscopic study, Geochim. Cosmochim. Acta 58 (1994), | ||
| low | 15 | 244 | list_item | reference | after_back_matter_stop | after_back_matter_stop | after_stop | p15:page_body:column_2_of_2:white | [255, 255, 255] white | [306.59, 175.04, 250.93, 21.78] | E.S. Ilton, J.E. Post, P.J. Heaney, F.T. Ling, S.N. Kerisit, XPS determination of Mn oxidation states in Mn (hydr)oxides, Appl. Surf. Sci. 366 (2016), https://doi.org/ 10.1016/j.apsusc.2015.12.159. | E.S. Ilton, J.E. Post, P.J. Heaney, F.T. Ling, S.N. Kerisit, XPS determination of Mn oxidation states in Mn (hydr)oxides, Appl. Surf. Sci. 366 (2016), 10.1016/j.apsusc.2015.12.159. | ||
| low | 15 | 245 | list_item | reference | after_back_matter_stop | after_back_matter_stop | after_stop | p15:page_body:column_2_of_2:white | [255, 255, 255] white | [306.59, 198.96, 250.96, 29.72] | J. Yan, M. Yuan, S. Xie, T. Wang, J. Liu, Z. Li, J. Peng, Improving the electrochemical performance of LiNi0.5Mn1.5O4 cathode material by a coating of manganese phosphate, J. Mater. Res. 38 (2023) 1293 -1303, https://doi.org/ 10.1557/S43578-022-00887-6/FIGURES/8. | J. Yan, M. Yuan, S. Xie, T. Wang, J. Liu, Z. Li, J. Peng, Improving the electrochemical performance of LiNi0.5Mn1.5O4 cathode material by a coating of manganese phosphate, J. Mater. Res. 38 (2023) 1293 -1303, 10.1557/S43578-022-00887-6/FIGURES/8. | ||
| low | 15 | 246 | list_item | reference | after_back_matter_stop | after_back_matter_stop | after_stop | p15:page_body:column_2_of_2:white | [255, 255, 255] white | [306.59, 230.83, 250.95, 21.78] | S. Jamil, C. Li, M. Fasehullah, P. Liu, F. Xiao, H. Wang, S. Bao, M. Xu, Ni/Li antisite induced disordered passivation layer for high-Ni layered oxide cathode material, Energy Storage Mater. 45 (2022), https://doi.org/10.1016/j.ensm.2021.12.025. | S. Jamil, C. Li, M. Fasehullah, P. Liu, F. Xiao, H. Wang, S. Bao, M. Xu, Ni/Li antisite induced disordered passivation layer for high-Ni layered oxide cathode material, Energy Storage Mater. 45 (2022), | ||
| low | 15 | 247 | list_item | reference | after_back_matter_stop | after_back_matter_stop | after_stop | p15:page_body:column_2_of_2:white | [255, 255, 255] white | [306.59, 254.75, 250.96, 29.72] | S. Kaewmala, W. Limphirat, V. Yordsri, H. Kim, S. Muhammad, W.S. Yoon, S. Srilomsak, P. Limthongkul, N. Meethong, Structural and electrochemical kinetic properties of 0.5Li2MnO3 · 0.5LiCoO2 cathode materials with different Li2MnO3 domain sizes, Sci. Rep. 9 (2019), https://doi.org/10.1038/s41598-018-36593-9. | S. Kaewmala, W. Limphirat, V. Yordsri, H. Kim, S. Muhammad, W.S. Yoon, S. Srilomsak, P. Limthongkul, N. Meethong, Structural and electrochemical kinetic properties of 0.5Li2MnO3 · 0.5LiCoO2 cathode materials with different Li2MnO3 domain sizes, Sci. Rep. 9 (2019), | ||
| low | 15 | 248 | list_item | reference | after_back_matter_stop | after_back_matter_stop | after_stop | p15:page_body:column_2_of_2:white | [255, 255, 255] white | [306.59, 286.61, 250.94, 29.77] | Y. Zang, X. Sun, Z.F. Tang, H.F. Xiang, C.H. Chen, Vanadium-doped lithium-rich layered-structured cathode material Li 1.2 Ni 0.2 Mn 0.6 O 2 with a high specific capacity and improved rate performance, RSC Adv. 6 (2016) 30194 -30198, https://doi.org/10.1039/c6ra02472f. | Y. Zang, X. Sun, Z.F. Tang, H.F. Xiang, C.H. Chen, Vanadium-doped lithium-rich layered-structured cathode material Li 1.2 Ni 0.2 Mn 0.6 O 2 with a high specific capacity and improved rate performance, RSC Adv. 6 (2016) 30194 -30198, | ||
| low | 15 | 249 | list_item | reference | after_back_matter_stop | after_back_matter_stop | after_stop | p15:page_body:column_2_of_2:white | [255, 255, 255] white | [306.59, 318.47, 250.95, 29.77] | Z. Feng, H. Song, W. Su, M. Liu, Y. Li, R. Chen, S. Xu, Y. Lyu, D. Xiao, B. Guo, Improved electrochemical kinetics and interfacial stability of cobalt-free lithiumrich layered oxides via thiourea treatment, Chem. Eng. J. 450 (2022), https://doi. org/10.1016/j.cej.2022.138114. | Z. Feng, H. Song, W. Su, M. Liu, Y. Li, R. Chen, S. Xu, Y. Lyu, D. Xiao, B. Guo, Improved electrochemical kinetics and interfacial stability of cobalt-free lithiumrich layered oxides via thiourea treatment, Chem. Eng. J. 450 (2022), org/10.1016/j.cej.2022.138114. | ||
| low | 15 | 250 | list_item | reference | after_back_matter_stop | after_back_matter_stop | after_stop | p15:page_body:column_2_of_2:white | [255, 255, 255] white | [306.59, 350.39, 250.96, 21.78] | B. Song, C. Zhou, Y. Chen, Z. Liu, M.O. Lai, J. Xue, L. Lu, Role of carbon coating in improving electrochemical performance of Li-rich Li(Li0.2Mn0.54Ni0.13Co0.13) O2 cathode, RSC Adv. 4 (2014), https://doi.org/10.1039/c4ra04976d. | B. Song, C. Zhou, Y. Chen, Z. Liu, M.O. Lai, J. Xue, L. Lu, Role of carbon coating in improving electrochemical performance of Li-rich Li(Li0.2Mn0.54Ni0.13Co0.13) O2 cathode, RSC Adv. 4 (2014), | ||
| low | 15 | 251 | page_footer | page_footer | after_back_matter_stop | after_back_matter_stop | after_stop | p15:bottom_margin:column_2_of_2:white | [255, 255, 255] white | [294.42, 754.46, 7.18, 10.42] | 15 | 15 |