这里是差集:Docling 全量解析 text block 减去最终会进入正文的 block。优先人工检查 risk=high / medium。
layout_review.html excluded_blocks.json excluded_blocks.tsv final_body_blocks.tsv visual_assets.tsv original.pdf
{
  "parsed_text_blocks": 154,
  "final_body_blocks": 14,
  "excluded_blocks": {
    "count": 140,
    "by_reason": {
      "after_back_matter_stop": 103,
      "docling_page_header": 8,
      "first_page_metadata": 8,
      "docling_footnote": 7,
      "docling_page_footer": 5,
      "non_body_heading": 2,
      "outside_body_flow_caption": 2,
      "back_matter_heading": 1,
      "before_body_started": 1,
      "document_web_address": 1,
      "front_matter_author_line": 1,
      "front_matter_heading": 1
    },
    "by_role_guess": {
      "reference": 48,
      "page_footer": 19,
      "page_header": 18,
      "body_candidate_excluded": 13,
      "metadata": 10,
      "footnote": 7,
      "unknown_text": 7,
      "back_matter_text": 6,
      "caption": 5,
      "back_matter_heading": 3,
      "title_candidate": 2,
      "affiliation": 1,
      "front_matter_heading": 1
    },
    "by_risk_level": {
      "low": 127,
      "medium": 13
    },
    "high_risk_count": 0,
    "medium_risk_count": 13
  },
  "char_counts": {
    "parsed_text_chars": 43999,
    "final_body_chars": 12156,
    "excluded_chars": 31843
  }
}
{
  "truncated": true,
  "message": "Body extraction stopped at page 4 block #/texts/41#prov1: Supporting Information Figure S3. Figure 1 (c -f) and Supporting Information Figure S4 show elemental distribution captured by EDS mapping of a pristine particle. In Figure 1c, the particle was tilted to [010] zone axis…. 103 following text blocks were excluded as after_back_matter_stop.",
  "stop_trigger": {
    "ref": "#/texts/41#prov1",
    "page": 4,
    "layout_order": 50,
    "role_guess": "back_matter_heading",
    "body_decision_reason": "back_matter_heading",
    "text_preview": "Supporting Information Figure S3. Figure 1 (c -f) and Supporting Information Figure S4 show elemental distribution captured by EDS mapping of a pristine particle. In Figure 1c, the particle was tilted to [010] zone axis…"
  },
  "first_truncated_block": {
    "ref": "#/texts/47#prov0",
    "page": 4,
    "layout_order": 51,
    "role_guess": "body_candidate_excluded",
    "body_decision_reason": "after_back_matter_stop",
    "text_preview": "Cycling induced structural change. In this section, we discuss the structural evolution of the particle upon cyclic charge and discharge. Supporting Information Figure S5 shows the fi rst charge/discharge cycle and capa…"
  },
  "truncated_block_count": 103,
  "truncated_pages": [
    4,
    5,
    6,
    7,
    8,
    9
  ],
  "by_role_guess": {
    "reference": 48,
    "body_candidate_excluded": 12,
    "page_footer": 12,
    "page_header": 10,
    "unknown_text": 7,
    "back_matter_text": 6,
    "caption": 3,
    "metadata": 3,
    "back_matter_heading": 2
  }
}
这些框显示被排除块,同时叠加真实图表资产框。青色虚线表示该 text block 被图表资产 caption 吸收;红色 STOP 是截断触发点,红色框是截断后被排除的块。
这是实际图表资产输出,不是审计层重新推断。
| # | type | label | page | caption source | suppressed | duplicate reason | rescue reason | group | confidence | bbox | caption |
|---|---|---|---|---|---|---|---|---|---|---|---|
| 1 | figure | Docling Figure 1 | 1 | missing_caption | 0.55 | [314.57, 410.37, 242.33, 104.54] | |||||
| 2 | figure | Fig. 1 | 3 | direct_caption_ref | 0.82 | [161.38, 66.05, 301.22, 412.29] | Figure 1. (a) low magni fi cation and (b) high resolution STEM-HAADF images of the PNS layer in a pristine particle. White arrows in (b) indicate ordered features along (20 -2) planes. Red arrows in (b) indicated Li-slabs being inserted heavy TM cations in the PNS layer. A [010] direction C 2/ m crystal structure is shown as inset map in (b). Green: Li; Blue: Ni; Purple: Mn; Red: O. (c) STEM-HAADF image of EDS mapping area. The particle was tilted to [010] zone and its surface facets were determined. (d) Corresponding Ni elemental mapping. (e) Line scan signal counts across the PNS layer, whose location is shown in the STEM-HAADF image; (f) Quantitative Ni/Mn atomic ratios along the line scan. The Ni/Mn ratios are around 0.35 in bulk region, which is close to the designed value 0.33. | ||||
| 3 | figure | Fig. 2 | 4 | direct_caption_ref | 0.82 | [160.9, 64.69, 301.7, 350.7] | Figure 2. (a-d) Low magni fi cation STEM-HAADF images to show cycling induced corrosion. Cracks and pits are highlighted by red arrows. (002) surface planes show strong resistance to corrosion. e-h) [010] zone axis SAED patterns. Extra di ff raction spots appeared in cycled samples, which are highlighted by red and blue circles. Red circles indicated the formation of ordered structure. (10 -1) ordered plane is clearly seen after cycling. Blue circles come from double di ff raction. (i -l) High resolution STEM-HAADF images to show the cycling induced structure change on particle surfaces. Pristine samples (i) shows homogeneous structure from surface to bulk. Dashed lines in (j, k) highlight the thickness of the SRL. In (l), the whole areas were transformed. (m) [101] zone axis STEM-HAADF image and its fast Fourier transformation image. Blue arrows indicate the ordered features of (20 -2) planes and extra di ff raction spots. (n) [010] zone axis STEM-HAADF image to show spinel structure and I41 structure in a 45 cycled sample. | ||||
| 4 | figure | Fig. 3 | 5 | direct_caption_ref | 0.82 | [104.5, 67.51, 412.09, 458.65] | Figure 3. (a-d) EDS mapping results from a 45 cycled LMR particle. The particle was tilted to the [010] zone axis and three surface facets were determined in (b). (e) Quantitative Ni/Mn ratios from surface and bulk positions as marked in (a); (f) line scan signal counts; (g) Quantitative Ni/ Mn atomic ratios along the line scan. The Ni/Mn ratios are around 0.26 in bulk region. (h)Low loss EELS spectra and (i) high low EELS spectra from di ff erent samples. 4.7 V bulk: spectrum collected from 4.7 V overcharged sample ' s bulk region; 100S: spectra collected from the surface of 100 cycled sample; 45S: spectra collected from the surface of 45 cycled sample; PNS: spectra collected from the Ni-rich surface of pristine sample; PS: spectra collected from pristine sample surface without Ni-rich layer; Li2O: spectrum collected from Li2O sample; Bulk: spectrum collected from pristine sample ' s bulk region. The degree of Li -K edge depression is 4.7 V bulk >100S > 45S ≈ PNS > PS. The order of Mn L3/L2 ratio is 100S > 45S > PNS ≈ PS ≈ Bulk. | ||||
| 5 | figure | Fig. 4 | 7 | direct_caption_ref | 0.82 | [99.49, 65.21, 426.88, 349.49] | Figure 4. Comparison between experimental results and simulation results of di ff erent crystal models for the SRL from the [010] zone axis. I41 structure matches best in the four crystal models. | ||||
| 6 | figure | Fig. 5 | 7 | direct_caption_ref | 0.82 | [142.46, 454.0, 339.52, 205.34] | Figure 5. Schematic diagram to show cycling induced surface layer evolution. At left side, the pristine particle has a C 2/ m structure and PNS layers are located at (20 -2) surface planes. After cycling, due to Ni 2+ migration from bulk to surface, Mn 2+ surface aggregation and Li + depletion in surface layer, SRL is developed on particle surface except the PNS. The structure of surface layer transforms from original C 2/ m into I41 and fi nally developed spinel structure due to progressive TM enrichment and Li depletion. I41 structure is the main phase in the SRL. |
| risk | page | order | label | role | reason | parser reason | production usage | trunc | body region | region | bg | bbox | raw text | cleaned text |
|---|---|---|---|---|---|---|---|---|---|---|---|---|---|---|
| medium | 1 | 3 | text | body_candidate_excluded | before_body_started | before_body_started | p1:body_region:0 | p1:page_body:column_1_of_2:white | [255, 255, 255] white | [60.49, 174.05, 504.0, 46.22] | Pengfei Yan, † Anmin Nie, ‡ Jianming Zheng, § Yungang Zhou, ∥ Dongping Lu, § Xiaofeng Zhang, ⊥ Rui Xu, ⊥ Ilias Belharouak, ⊥ , ¶ Xiaotao Zu, ∥ Jie Xiao, § Khalil Amine, ⊥ Jun Liu, § Fei Gao, ○ Reza Shahbazian-Yassar, ‡ Ji-Guang Zhang, * , § and Chong-Min Wang * , † | Pengfei Yan, † Anmin Nie, ‡ Jianming Zheng, § Yungang Zhou, ∥ Dongping Lu, § Xiaofeng Zhang, ⊥ Rui Xu, ⊥ Ilias Belharouak, ⊥ , ¶ Xiaotao Zu, ∥ Jie Xiao, § Khalil Amine, ⊥ Jun Liu, § Fei Gao, ○ Reza Shahbazian-Yassar, ‡ Ji-Guang Zhang, * , § and Chong-Min Wang * , † | ||
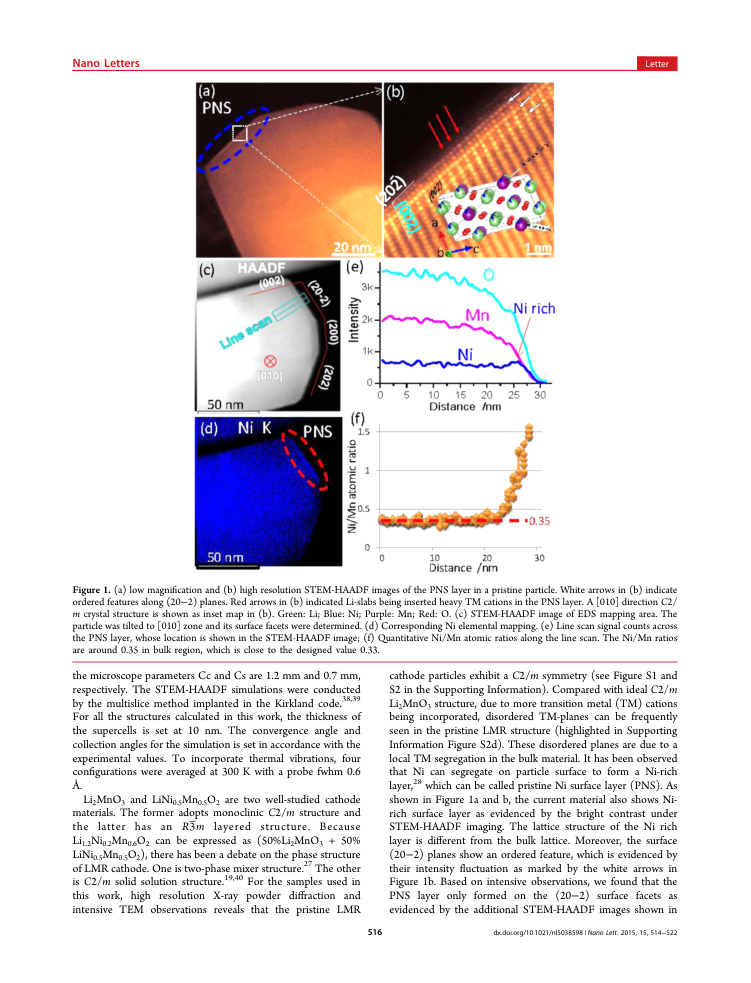
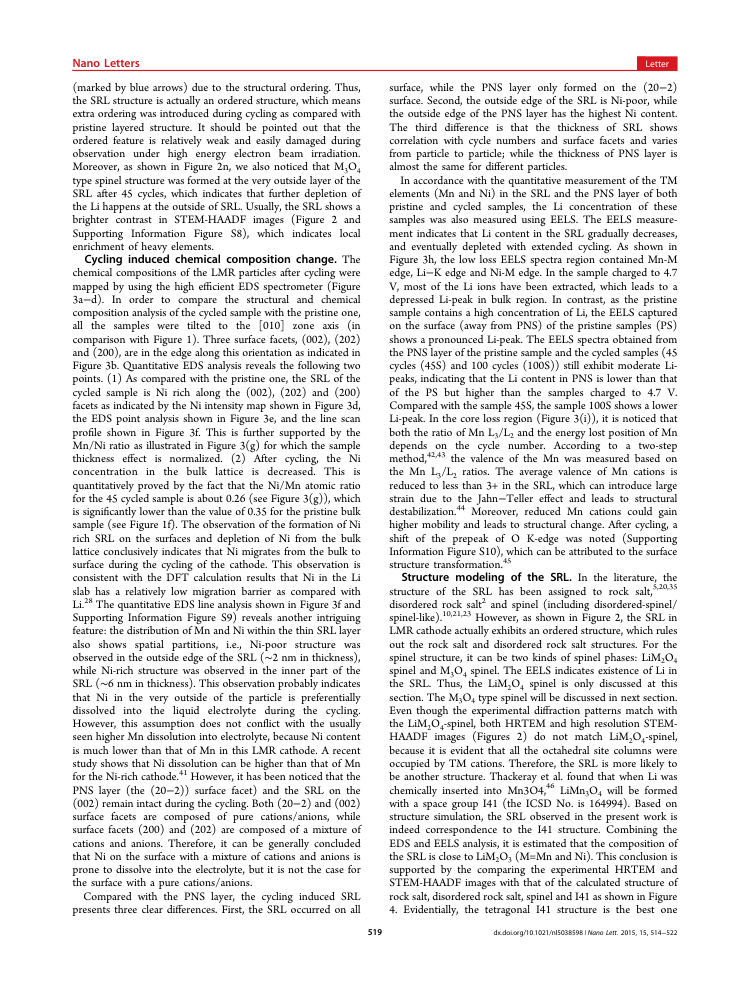
| medium | 4 | 51 | text | body_candidate_excluded | after_back_matter_stop | after_back_matter_stop | after_stop | p4:body_region:1 | p4:bottom_margin:column_2_of_2:white | [255, 255, 255] white | [324.45, 516.54, 240.03, 246.66] | Cycling induced structural change. In this section, we discuss the structural evolution of the particle upon cyclic charge and discharge. Supporting Information Figure S5 shows the fi rst charge/discharge cycle and capacity as a function of cycle numbers, which shows a proper cell performance. The overall morphological evolution of the particle during the cycling is investigated by STEM-HAADF as shown in Figure 2a -d. It is evident that upon cycling the particle was corroded in the electrolyte, leading to the formation of cracks and pits as shown in Figure 2c and d. Surprisingly, it is found that the corrosion happens only on certain crystallographic facets, typically (200) and (202) planes, which are composed of a mixture of cations and anions (inset of Figure 1(b)). In contrast, the crystallographic planes, such as (002) and (20 -2), which are composed of pure cations/anions (inset of Figure 1(b)), are relatively stable and show strong resistance against corrosion. This observation is further con fi rmed by the conventional TEM images shown in Figure S6 in the Supporting Information. Even though there are some mechanisms to explain how surface corrosion happened, 23,24 it is still far away from fully understanding its actual process. Obviously, surface corrosion should be closely related to | Cycling induced structural change. In this section, we discuss the structural evolution of the particle upon cyclic charge and discharge. Supporting Information Figure S5 shows the fi rst charge/discharge cycle and capacity as a function of cycle numbers, which shows a proper cell performance. The overall morphological evolution of the particle during the cycling is investigated by STEM-HAADF as shown in Figure 2a -d. It is evident that upon cycling the particle was corroded in the electrolyte, leading to the formation of cracks and pits as shown in Figure 2c and d. Surprisingly, it is found that the corrosion happens only on certain crystallographic facets, typically (200) and (202) planes, which are composed of a mixture of cations and anions (inset of Figure 1(b)). In contrast, the crystallographic planes, such as (002) and (20 -2), which are composed of pure cations/anions (inset of Figure 1(b)), are relatively stable and show strong resistance against corrosion. This observation is further con fi rmed by the conventional TEM images shown in Figure S6 in the Supporting Information. Even though there are some mechanisms to explain how surface corrosion happened, 23,24 it is still far away from fully understanding its actual process. Obviously, surface corrosion should be closely related to | |
| medium | 5 | 58 | text | body_candidate_excluded | after_back_matter_stop | after_back_matter_stop | after_stop | p5:body_region:0 | p5:bottom_margin:column_1_of_2:white | [255, 255, 255] white | [60.49, 649.57, 240.0, 113.63] | Upon cycling, the most discernible change of the LMR particle is the formation of a surface reconstruction layer (SRL), as representatively shown by the STEM-HAADF images in Figure 2j -n and HRTEM images in Supporting Information Figure S7. It should be noted that when taking these images, we always avoided the (20 -2) surface due to its initial Ni segregation and structure ordering. Structurally, within the SRL, TM cations have occupied the octahedral sites in Li-slabs. The thickness of the SRL increases with increasing number of cycles. Formation of the SRL is also con fi rmed by | Upon cycling, the most discernible change of the LMR particle is the formation of a surface reconstruction layer (SRL), as representatively shown by the STEM-HAADF images in Figure 2j -n and HRTEM images in Supporting Information Figure S7. It should be noted that when taking these images, we always avoided the (20 -2) surface due to its initial Ni segregation and structure ordering. Structurally, within the SRL, TM cations have occupied the octahedral sites in Li-slabs. The thickness of the SRL increases with increasing number of cycles. Formation of the SRL is also con fi rmed by | |
| medium | 5 | 59 | text | body_candidate_excluded | after_back_matter_stop | after_back_matter_stop | after_stop | p5:body_region:1 | p5:bottom_margin:column_2_of_2:white | [255, 255, 255] white | [324.45, 623.24, 240.03, 140.69] | SAED patterns. As shown in Figure 2e -h, compared with pristine sample, cycled samples show extra spots (highlighted by red and blue circles). The blue circles indicate double di ff raction spots. The stronger double di ff raction spots from 45 and 100 cycled samples indicate they have thicker SRLs. By indexing the SAED patterns, we found the (20 -2) planes were ordered and formed by double spacing (10 -1) planes, which was further con fi rmed by high resolution STEM-HAADF images shown in the insets of Figure 2k and 2(m). The blue arrows in Figure 2m indicate the ordering features of (20 -2) planes from a [101] zone axis and its corresponding fast Fourier transformation images clearly show extra (10 -1) spots | SAED patterns. As shown in Figure 2e -h, compared with pristine sample, cycled samples show extra spots (highlighted by red and blue circles). The blue circles indicate double di ff raction spots. The stronger double di ff raction spots from 45 and 100 cycled samples indicate they have thicker SRLs. By indexing the SAED patterns, we found the (20 -2) planes were ordered and formed by double spacing (10 -1) planes, which was further con fi rmed by high resolution STEM-HAADF images shown in the insets of Figure 2k and 2(m). The blue arrows in Figure 2m indicate the ordering features of (20 -2) planes from a [101] zone axis and its corresponding fast Fourier transformation images clearly show extra (10 -1) spots | |
| medium | 6 | 63 | text | body_candidate_excluded | after_back_matter_stop | after_back_matter_stop | after_stop | p6:body_region:0 | p6:page_body:column_1_of_2:white | [255, 255, 255] white | [60.49, 69.37, 240.0, 141.41] | (marked by blue arrows) due to the structural ordering. Thus, the SRL structure is actually an ordered structure, which means extra ordering was introduced during cycling as compared with pristine layered structure. It should be pointed out that the ordered feature is relatively weak and easily damaged during observation under high energy electron beam irradiation. Moreover, as shown in Figure 2n, we also noticed that M3O4 type spinel structure was formed at the very outside layer of the SRL after 45 cycles, which indicates that further depletion of the Li happens at the outside of SRL. Usually, the SRL shows a brighter contrast in STEM-HAADF images (Figure 2 and Supporting Information Figure S8), which indicates local enrichment of heavy elements. | (marked by blue arrows) due to the structural ordering. Thus, the SRL structure is actually an ordered structure, which means extra ordering was introduced during cycling as compared with pristine layered structure. It should be pointed out that the ordered feature is relatively weak and easily damaged during observation under high energy electron beam irradiation. Moreover, as shown in Figure 2n, we also noticed that M3O4 type spinel structure was formed at the very outside layer of the SRL after 45 cycles, which indicates that further depletion of the Li happens at the outside of SRL. Usually, the SRL shows a brighter contrast in STEM-HAADF images (Figure 2 and Supporting Information Figure S8), which indicates local enrichment of heavy elements. | |
| medium | 6 | 67 | text | body_candidate_excluded | after_back_matter_stop | after_back_matter_stop | after_stop | p6:body_region:1 | p6:page_body:column_2_of_2:white | [255, 255, 255] white | [324.45, 66.0, 240.04, 78.45] | surface, while the PNS layer only formed on the (20 -2) surface. Second, the outside edge of the SRL is Ni-poor, while the outside edge of the PNS layer has the highest Ni content. The third di ff erence is that the thickness of SRL shows correlation with cycle numbers and surface facets and varies from particle to particle; while the thickness of PNS layer is almost the same for di ff erent particles. | surface, while the PNS layer only formed on the (20 -2) surface. Second, the outside edge of the SRL is Ni-poor, while the outside edge of the PNS layer has the highest Ni content. The third di ff erence is that the thickness of SRL shows correlation with cycle numbers and surface facets and varies from particle to particle; while the thickness of PNS layer is almost the same for di ff erent particles. | |
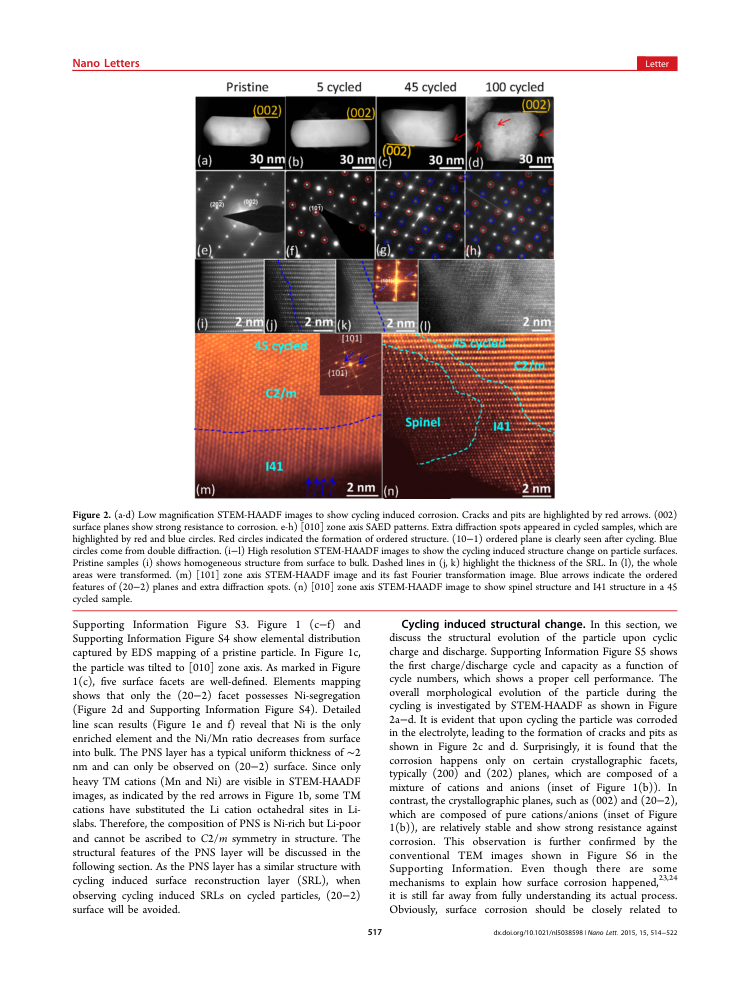
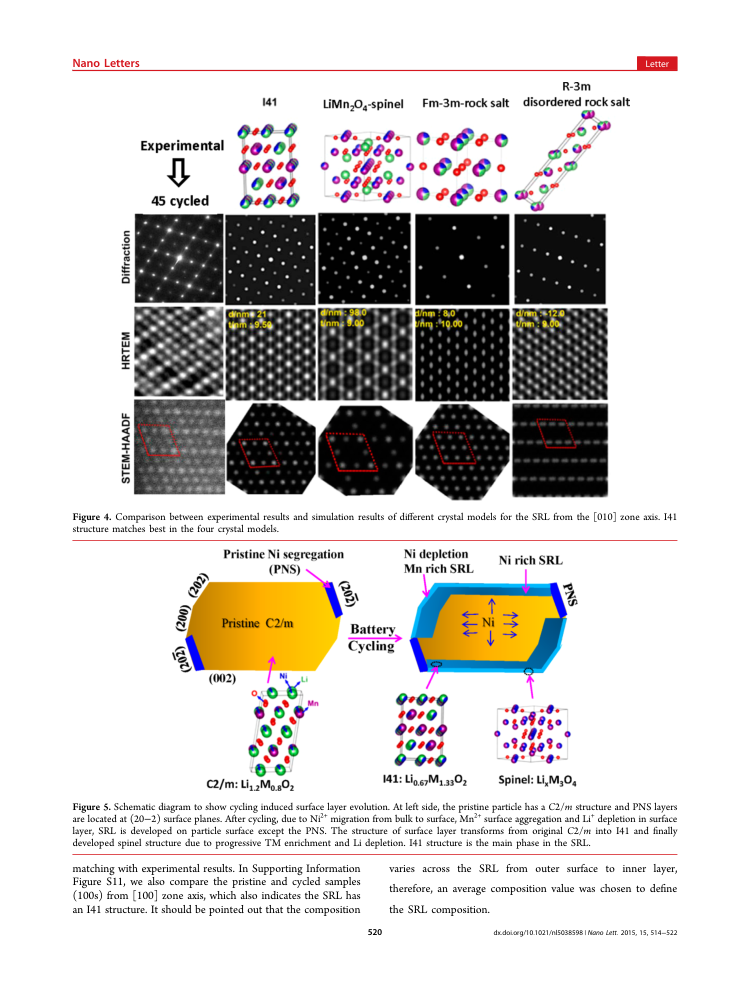
| medium | 6 | 68 | text | body_candidate_excluded | after_back_matter_stop | after_back_matter_stop | after_stop | p6:body_region:1 | p6:page_body:column_2_of_2:white | [255, 255, 255] white | [324.45, 146.7, 240.04, 329.24] | In accordance with the quantitative measurement of the TM elements (Mn and Ni) in the SRL and the PNS layer of both pristine and cycled samples, the Li concentration of these samples was also measured using EELS. The EELS measurement indicates that Li content in the SRL gradually decreases, and eventually depleted with extended cycling. As shown in Figure 3h, the low loss EELS spectra region contained Mn-M edge, Li -K edge and Ni-M edge. In the sample charged to 4.7 V, most of the Li ions have been extracted, which leads to a depressed Li-peak in bulk region. In contrast, as the pristine sample contains a high concentration of Li, the EELS captured on the surface (away from PNS) of the pristine samples (PS) shows a pronounced Li-peak. The EELS spectra obtained from the PNS layer of the pristine sample and the cycled samples (45 cycles (45S) and 100 cycles (100S)) still exhibit moderate Lipeaks, indicating that the Li content in PNS is lower than that of the PS but higher than the samples charged to 4.7 V. Compared with the sample 45S, the sample 100S shows a lower Li-peak. In the core loss region (Figure 3(i)), it is noticed that both the ratio of Mn L 3/L2 and the energy lost position of Mn depends on the cycle number. According to a two-step method, 42,43 the valence of the Mn was measured based on the Mn L3/L2 ratios. The average valence of Mn cations is reduced to less than 3+ in the SRL, which can introduce large strain due to the Jahn -Teller e ff ect and leads to structural destabilization. 44 Moreover, reduced Mn cations could gain higher mobility and leads to structural change. After cycling, a shift of the prepeak of O K-edge was noted (Supporting Information Figure S10), which can be attributed to the surface structure transformation. 45 | In accordance with the quantitative measurement of the TM elements (Mn and Ni) in the SRL and the PNS layer of both pristine and cycled samples, the Li concentration of these samples was also measured using EELS. The EELS measurement indicates that Li content in the SRL gradually decreases, and eventually depleted with extended cycling. As shown in Figure 3h, the low loss EELS spectra region contained Mn-M edge, Li -K edge and Ni-M edge. In the sample charged to 4.7 V, most of the Li ions have been extracted, which leads to a depressed Li-peak in bulk region. In contrast, as the pristine sample contains a high concentration of Li, the EELS captured on the surface (away from PNS) of the pristine samples (PS) shows a pronounced Li-peak. The EELS spectra obtained from the PNS layer of the pristine sample and the cycled samples (45 cycles (45S) and 100 cycles (100S)) still exhibit moderate Lipeaks, indicating that the Li content in PNS is lower than that of the PS but higher than the samples charged to 4.7 V. Compared with the sample 45S, the sample 100S shows a lower Li-peak. In the core loss region (Figure 3(i)), it is noticed that both the ratio of Mn L 3/L2 and the energy lost position of Mn depends on the cycle number. According to a two-step method, 42,43 the valence of the Mn was measured based on the Mn L3/L2 ratios. The average valence of Mn cations is reduced to less than 3+ in the SRL, which can introduce large strain due to the Jahn -Teller e ff ect and leads to structural destabilization. 44 Moreover, reduced Mn cations could gain higher mobility and leads to structural change. After cycling, a shift of the prepeak of O K-edge was noted (Supporting Information Figure S10), which can be attributed to the surface structure transformation. 45 | |
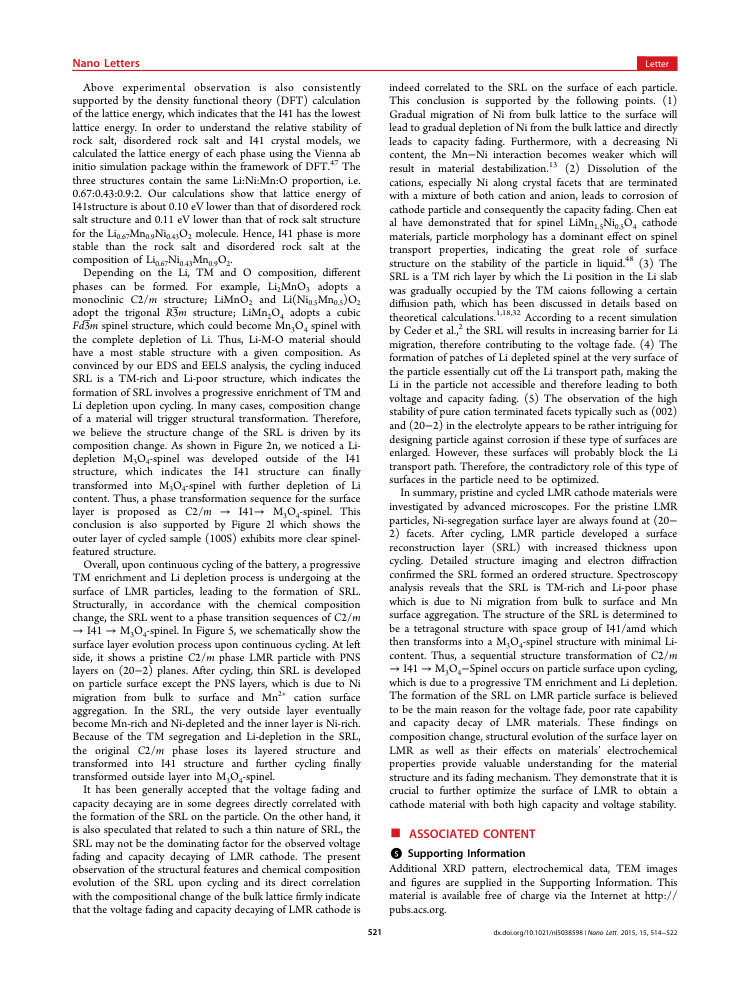
| medium | 7 | 76 | text | body_candidate_excluded | after_back_matter_stop | after_back_matter_stop | after_stop | p7:bottom_margin:column_1_of_2:white | [255, 255, 255] white | [60.49, 720.04, 239.95, 43.16] | matching with experimental results. In Supporting Information Figure S11, we also compare the pristine and cycled samples (100s) from [100] zone axis, which also indicates the SRL has an I41 structure. It should be pointed out that the composition | matching with experimental results. In Supporting Information Figure S11, we also compare the pristine and cycled samples (100s) from [100] zone axis, which also indicates the SRL has an I41 structure. It should be pointed out that the composition | ||
| medium | 7 | 77 | text | body_candidate_excluded | after_back_matter_stop | after_back_matter_stop | after_stop | p7:bottom_margin:column_2_of_2:white | [255, 255, 255] white | [324.45, 720.04, 240.01, 43.16] | varies across the SRL from outer surface to inner layer, therefore, an average composition value was chosen to de fi ne the SRL composition. | varies across the SRL from outer surface to inner layer, therefore, an average composition value was chosen to de fi ne the SRL composition. | ||
| medium | 8 | 83 | text | body_candidate_excluded | after_back_matter_stop | after_back_matter_stop | after_stop | p8:body_region:0 | p8:page_body:column_1_of_2:white | [255, 255, 255] white | [60.49, 467.13, 239.98, 186.73] | Overall, upon continuous cycling of the battery, a progressive TM enrichment and Li depletion process is undergoing at the surface of LMR particles, leading to the formation of SRL. Structurally, in accordance with the chemical composition change, the SRL went to a phase transition sequences of C 2/ m → I41 → M3O4-spinel. In Figure 5, we schematically show the surface layer evolution process upon continuous cycling. At left side, it shows a pristine C 2/ m phase LMR particle with PNS layers on (20 -2) planes. After cycling, thin SRL is developed on particle surface except the PNS layers, which is due to Ni migration from bulk to surface and Mn 2+ cation surface aggregation. In the SRL, the very outside layer eventually become Mn-rich and Ni-depleted and the inner layer is Ni-rich. Because of the TM segregation and Li-depletion in the SRL, the original C 2/ m phase loses its layered structure and transformed into I41 structure and further cycling fi nally transformed outside layer into M 3 O4-spinel. | Overall, upon continuous cycling of the battery, a progressive TM enrichment and Li depletion process is undergoing at the surface of LMR particles, leading to the formation of SRL. Structurally, in accordance with the chemical composition change, the SRL went to a phase transition sequences of C 2/ m → I41 → M3O4-spinel. In Figure 5, we schematically show the surface layer evolution process upon continuous cycling. At left side, it shows a pristine C 2/ m phase LMR particle with PNS layers on (20 -2) planes. After cycling, thin SRL is developed on particle surface except the PNS layers, which is due to Ni migration from bulk to surface and Mn 2+ cation surface aggregation. In the SRL, the very outside layer eventually become Mn-rich and Ni-depleted and the inner layer is Ni-rich. Because of the TM segregation and Li-depletion in the SRL, the original C 2/ m phase loses its layered structure and transformed into I41 structure and further cycling fi nally transformed outside layer into M 3 O4-spinel. | |
| medium | 8 | 84 | text | body_candidate_excluded | after_back_matter_stop | after_back_matter_stop | after_stop | p8:body_region:0 | p8:bottom_margin:column_1_of_2:white | [255, 255, 255] white | [60.49, 654.9, 239.99, 108.3] | It has been generally accepted that the voltage fading and capacity decaying are in some degrees directly correlated with the formation of the SRL on the particle. On the other hand, it is also speculated that related to such a thin nature of SRL, the SRL may not be the dominating factor for the observed voltage fading and capacity decaying of LMR cathode. The present observation of the structural features and chemical composition evolution of the SRL upon cycling and its direct correlation with the compositional change of the bulk lattice fi rmly indicate that the voltage fading and capacity decaying of LMR cathode is | It has been generally accepted that the voltage fading and capacity decaying are in some degrees directly correlated with the formation of the SRL on the particle. On the other hand, it is also speculated that related to such a thin nature of SRL, the SRL may not be the dominating factor for the observed voltage fading and capacity decaying of LMR cathode. The present observation of the structural features and chemical composition evolution of the SRL upon cycling and its direct correlation with the compositional change of the bulk lattice fi rmly indicate that the voltage fading and capacity decaying of LMR cathode is | |
| medium | 8 | 87 | text | body_candidate_excluded | after_back_matter_stop | after_back_matter_stop | after_stop | p8:body_region:1 | p8:page_body:column_2_of_2:white | [255, 255, 255] white | [324.45, 407.44, 240.04, 268.06] | In summary, pristine and cycled LMR cathode materials were investigated by advanced microscopes. For the pristine LMR particles, Ni-segregation surface layer are always found at (20 -2) facets. After cycling, LMR particle developed a surface reconstruction layer (SRL) with increased thickness upon cycling. Detailed structure imaging and electron di ff raction con fi rmed the SRL formed an ordered structure. Spectroscopy analysis reveals that the SRL is TM-rich and Li-poor phase which is due to Ni migration from bulk to surface and Mn surface aggregation. The structure of the SRL is determined to be a tetragonal structure with space group of I41/amd which then transforms into a M 3 O4-spinel structure with minimal Licontent. Thus, a sequential structure transformation of C 2/ m → I41 → M3O4 -Spinel occurs on particle surface upon cycling, which is due to a progressive TM enrichment and Li depletion. The formation of the SRL on LMR particle surface is believed to be the main reason for the voltage fade, poor rate capability and capacity decay of LMR materials. These fi ndings on composition change, structural evolution of the surface layer on LMR as well as their e ff ects on materials ' electrochemical properties provide valuable understanding for the material structure and its fading mechanism. They demonstrate that it is crucial to further optimize the surface of LMR to obtain a cathode material with both high capacity and voltage stability. | In summary, pristine and cycled LMR cathode materials were investigated by advanced microscopes. For the pristine LMR particles, Ni-segregation surface layer are always found at (20 -2) facets. After cycling, LMR particle developed a surface reconstruction layer (SRL) with increased thickness upon cycling. Detailed structure imaging and electron di ff raction con fi rmed the SRL formed an ordered structure. Spectroscopy analysis reveals that the SRL is TM-rich and Li-poor phase which is due to Ni migration from bulk to surface and Mn surface aggregation. The structure of the SRL is determined to be a tetragonal structure with space group of I41/amd which then transforms into a M 3 O4-spinel structure with minimal Licontent. Thus, a sequential structure transformation of C 2/ m → I41 → M3O4 -Spinel occurs on particle surface upon cycling, which is due to a progressive TM enrichment and Li depletion. The formation of the SRL on LMR particle surface is believed to be the main reason for the voltage fade, poor rate capability and capacity decay of LMR materials. These fi ndings on composition change, structural evolution of the surface layer on LMR as well as their e ff ects on materials ' electrochemical properties provide valuable understanding for the material structure and its fading mechanism. They demonstrate that it is crucial to further optimize the surface of LMR to obtain a cathode material with both high capacity and voltage stability. | |
| medium | 8 | 90 | text | body_candidate_excluded | after_back_matter_stop | after_back_matter_stop | after_stop | p8:body_region:1 | p8:bottom_margin:column_2_of_2:white | [255, 255, 255] white | [324.45, 720.55, 240.0, 42.65] | Additional XRD pattern, electrochemical data, TEM images and fi gures are supplied in the Supporting Information. This material is available free of charge via the Internet at http:// pubs.acs.org. | Additional XRD pattern, electrochemical data, TEM images and fi gures are supplied in the Supporting Information. This material is available free of charge via the Internet at http:// pubs.acs.org. | |
| low | 1 | 0 | page_header | page_header | docling_page_header | docling_page_header | p1:top_margin:column_2_of_2:colored | [238, 164, 167] colored | [537.96, 60.48, 19.47, 7.35] | Letter | Letter | |||
| low | 1 | 1 | text | metadata | document_web_address | document_web_address | p1:page_body:column_2_of_2:white | [255, 255, 255] white | [489.49, 76.75, 74.9, 7.35] | pubs.acs.org/NanoLett | pubs.acs.org/NanoLett | |||
| low | 1 | 2 | section_header | title_candidate | non_body_heading | non_body_heading | p1:body_region:0 | p1:page_body:column_1_of_2:white | [255, 255, 255] white | [60.49, 121.2, 503.96, 50.83] | Evolution of Lattice Structure and Chemical Composition of the Surface Reconstruction Layer in Li1.2Ni0.2Mn0.6O2 Cathode Material for Lithium Ion Batteries | Evolution of Lattice Structure and Chemical Composition of the Surface Reconstruction Layer in Li1.2Ni0.2Mn0.6O2 Cathode Material for Lithium Ion Batteries | ||
| low | 1 | 4 | page_header | page_header | docling_page_header | docling_page_header | p1:page_body:column_1_of_2:white | [255, 255, 255] white | [3.61, 223.96, 15.98, 347.54] | Downloaded via JILIN UNIV on July 12, 2026 at 04:41:59 (UTC). See https:/pubs.acs.org/sharingguidelines for options on how to legitimately share published articles. | Downloaded via JILIN UNIV on July 12, 2026 at 04:41:59 (UTC). See https:/pubs.acs.org/sharingguidelines for options on how to legitimately share published articles. | |||
| low | 1 | 5 | footnote | footnote | docling_footnote | docling_footnote | p1:body_region:0 | p1:page_body:column_1_of_2:white | [255, 255, 255] white | [60.49, 225.47, 468.18, 24.71] | † Environmental Molecular Sciences Laboratory, Paci fi c Northwest National Laboratory, 902 Battelle Boulevard, Richland, Washington 99352, United States | † Environmental Molecular Sciences Laboratory, Paci fi c Northwest National Laboratory, 902 Battelle Boulevard, Richland, Washington 99352, United States | ||
| low | 1 | 6 | footnote | footnote | docling_footnote | docling_footnote | p1:body_region:0 | p1:page_body:column_1_of_2:white | [255, 255, 255] white | [60.49, 250.47, 471.42, 24.71] | ‡ Department of Mechanical Engineering-Engineering Mechanics, Michigan Technological University, 1400 Townsend Dr., Houghton, Michigan 49931, United States | ‡ Department of Mechanical Engineering-Engineering Mechanics, Michigan Technological University, 1400 Townsend Dr., Houghton, Michigan 49931, United States | ||
| low | 1 | 7 | footnote | footnote | docling_footnote | docling_footnote | p1:body_region:0 | p1:page_body:column_1_of_2:white | [255, 255, 255] white | [60.49, 275.83, 488.88, 24.36] | § Energy and Environmental Directorate, Paci fi c Northwest National Laboratory, 902 Battelle Boulevard, Richland, Washington 99352, United States | § Energy and Environmental Directorate, Paci fi c Northwest National Laboratory, 902 Battelle Boulevard, Richland, Washington 99352, United States | ||
| low | 1 | 8 | text | affiliation | front_matter_author_line | front_matter_author_line | p1:body_region:0 | p1:page_body:column_1_of_2:white | [255, 255, 255] white | [60.49, 300.77, 503.95, 24.42] | ∥ Department of Applied Physics, University of Electronic Science and Technology of China, Chengdu 610054, People ' s Republic of China | ∥ Department of Applied Physics, University of Electronic Science and Technology of China, Chengdu 610054, People ' s Republic of China | ||
| low | 1 | 9 | footnote | footnote | docling_footnote | docling_footnote | p1:body_region:0 | p1:page_body:column_1_of_2:white | [255, 255, 255] white | [60.49, 325.77, 495.31, 24.42] | ⊥ Chemical Sciences and Engineering Division, Argonne National Laboratory, 9700 South Cass Avenue, Argonne, Illinois 60439, United States | ⊥ Chemical Sciences and Engineering Division, Argonne National Laboratory, 9700 South Cass Avenue, Argonne, Illinois 60439, United States | ||
| low | 1 | 10 | footnote | footnote | docling_footnote | docling_footnote | p1:body_region:0 | p1:page_body:column_1_of_2:white | [255, 255, 255] white | [60.49, 350.84, 387.04, 13.36] | ¶ Qatar Environment and Energy Research Institute, Qatar Foundation, P.O. Box 5825, Doha, Qatar | ¶ Qatar Environment and Energy Research Institute, Qatar Foundation, P.O. Box 5825, Doha, Qatar | ||
| low | 1 | 11 | footnote | footnote | docling_footnote | docling_footnote | p1:body_region:0 | p1:page_body:column_1_of_2:white | [255, 255, 255] white | [60.49, 365.19, 6.25, 8.05] | ○ | |||
| low | 1 | 12 | footnote | footnote | docling_footnote | docling_footnote | p1:page_body:column_1_of_2:white | [255, 255, 255] white | [66.73, 369.39, 497.7, 8.8] | Department of Nuclear Engineering and Radiological Sciences, University of Michigan, Ann Arbor, Michigan 48109, United States | Department of Nuclear Engineering and Radiological Sciences, University of Michigan, Ann Arbor, Michigan 48109, United States | |||
| low | 1 | 13 | section_header | title_candidate | non_body_heading | non_body_heading | p1:body_region:0 | p1:page_body:column_1_of_2:white | [255, 255, 255] white | [69.45, 385.15, 101.14, 12.62] | * S Supporting Information | * S Supporting Information | ||
| low | 1 | 16 | text | front_matter_heading | front_matter_heading | front_matter_heading | p1:body_region:0 | p1:page_body:column_1_of_2:colored | [255, 242, 208] colored | [69.45, 625.84, 459.96, 9.53] | KEYWORDS: lithium ion battery, LMR cathode, surface reconstruction, ion migration, voltage fading, Ni surface segregation | KEYWORDS: lithium ion battery, LMR cathode, surface reconstruction, ion migration, voltage fading, Ni surface segregation | ||
| low | 1 | 18 | page_footer | page_footer | first_page_metadata | first_page_metadata | p1:body_region:0 | p1:bottom_margin:column_1_of_2:white | [255, 255, 255] white | [168.49, 771.24, 95.03, 5.88] | © 2014 American Chemical Society | © 2014 American Chemical Society | ||
| low | 1 | 20 | text | metadata | first_page_metadata | first_page_metadata | p1:page_body:column_2_of_2:white | [255, 255, 255] white | [367.99, 727.13, 57.04, 7.92] | October 7, 2014 | October 7, 2014 | |||
| low | 1 | 21 | text | metadata | first_page_metadata | first_page_metadata | p1:page_body:column_2_of_2:white | [255, 255, 255] white | [324.45, 727.21, 34.65, 7.77] | Received: | Received: | |||
| low | 1 | 22 | text | metadata | first_page_metadata | first_page_metadata | p1:page_body:column_2_of_2:white | [255, 255, 255] white | [367.99, 738.19, 69.23, 7.92] | November 17, 2014 | November 17, 2014 | |||
| low | 1 | 23 | text | metadata | first_page_metadata | first_page_metadata | p1:page_body:column_2_of_2:white | [255, 255, 255] white | [324.45, 738.27, 30.25, 7.77] | Revised: | Revised: | |||
| low | 1 | 24 | text | metadata | first_page_metadata | first_page_metadata | p1:bottom_margin:column_2_of_2:white | [255, 255, 255] white | [367.99, 749.19, 63.96, 7.92] | December 8, 2014 | December 8, 2014 | |||
| low | 1 | 25 | text | metadata | first_page_metadata | first_page_metadata | p1:bottom_margin:column_2_of_2:white | [255, 255, 255] white | [324.45, 749.27, 37.75, 7.77] | Published: | Published: | |||
| low | 1 | 26 | page_footer | page_footer | first_page_metadata | first_page_metadata | p1:bottom_margin:column_2_of_2:white | [255, 255, 255] white | [411.19, 769.98, 153.29, 7.74] | dx.doi.org/10.1021/nl5038598 | Nano Lett. 2015, 15, 514 -522 | dx.doi.org/10.1021/nl5038598 | Nano Lett. 2015, 15, 514 -522 | |||
| low | 1 | 27 | page_footer | page_footer | docling_page_footer | docling_page_footer | p1:bottom_margin:column_2_of_2:white | [255, 255, 255] white | [306.48, 770.73, 11.95, 6.54] | 514 | 514 | |||
| low | 2 | 28 | page_header | page_header | docling_page_header | docling_page_header | p2:body_region:0 | p2:top_margin:column_1_of_2:white | [255, 255, 255] white | [60.49, 48.93, 55.9, 8.72] | Nano Letters | Nano Letters | ||
| low | 2 | 32 | page_header | page_header | docling_page_header | docling_page_header | p2:body_region:1 | p2:top_margin:column_2_of_2:colored | [238, 164, 167] colored | [537.96, 49.99, 19.47, 7.35] | Letter | Letter | ||
| low | 2 | 37 | page_footer | page_footer | docling_page_footer | docling_page_footer | p2:body_region:1 | p2:bottom_margin:column_2_of_2:white | [255, 255, 255] white | [411.19, 773.27, 153.29, 7.74] | dx.doi.org/10.1021/nl5038598 | Nano Lett. 2015, 15, 514 -522 | dx.doi.org/10.1021/nl5038598 | Nano Lett. 2015, 15, 514 -522 | ||
| low | 2 | 38 | page_footer | page_footer | docling_page_footer | docling_page_footer | p2:bottom_margin:column_2_of_2:white | [255, 255, 255] white | [306.48, 774.02, 11.95, 6.54] | 515 | 515 | |||
| low | 3 | 39 | page_header | page_header | docling_page_header | docling_page_header | p3:body_region:0 | p3:top_margin:column_1_of_2:white | [255, 255, 255] white | [60.49, 48.93, 55.9, 8.72] | Nano Letters | Nano Letters | ||
| low | 3 | 40 | page_header | page_header | docling_page_header | docling_page_header | p3:body_region:1 | p3:top_margin:column_2_of_2:colored | [238, 164, 167] colored | [537.96, 49.99, 19.47, 7.35] | Letter | Letter | ||
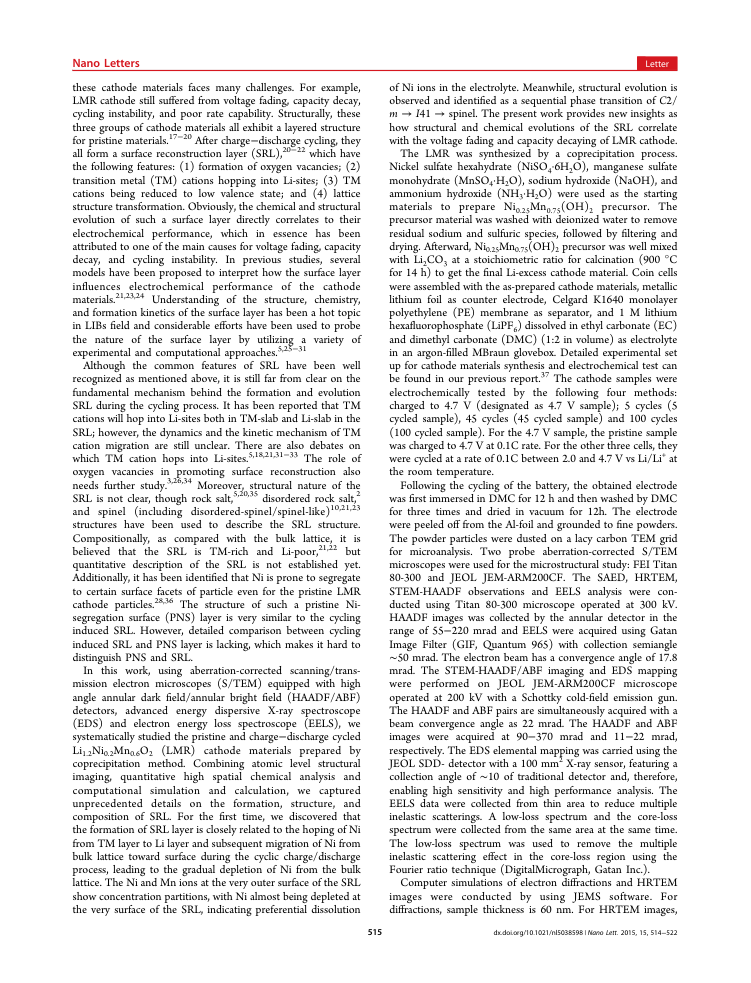
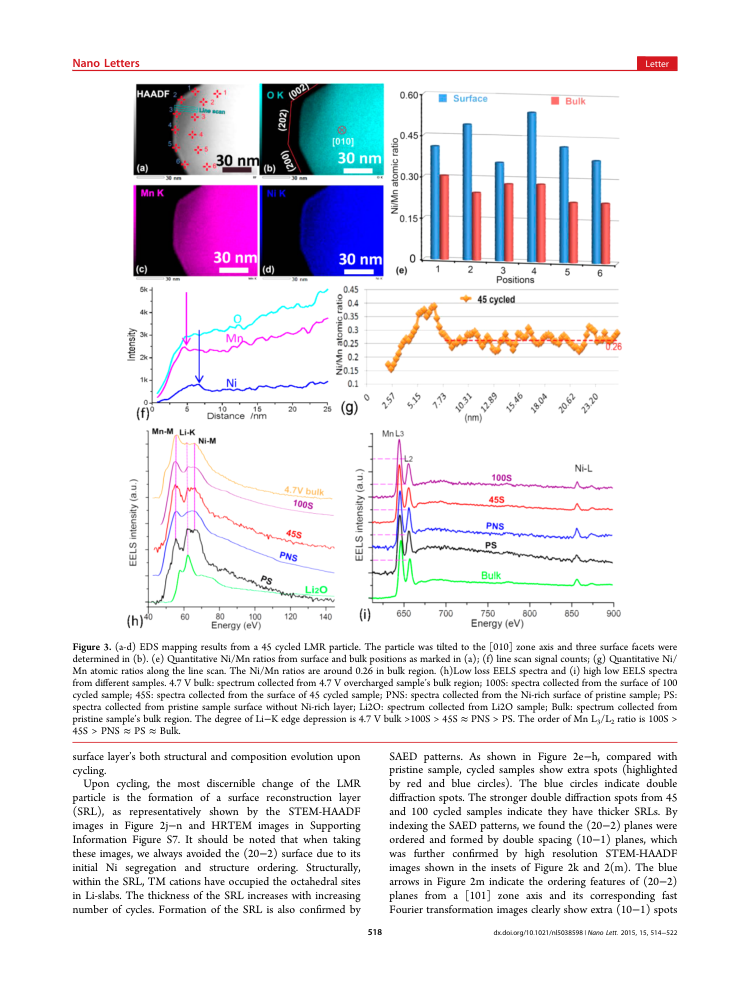
| low | 3 | 41 | caption | caption | outside_body_flow_caption | outside_body_flow_caption | p3:page_body:column_1_of_2:white | [255, 255, 255] white | [60.49, 488.68, 503.97, 57.93] | Figure 1. (a) low magni fi cation and (b) high resolution STEM-HAADF images of the PNS layer in a pristine particle. White arrows in (b) indicate ordered features along (20 -2) planes. Red arrows in (b) indicated Li-slabs being inserted heavy TM cations in the PNS layer. A [010] direction C 2/ m crystal structure is shown as inset map in (b). Green: Li; Blue: Ni; Purple: Mn; Red: O. (c) STEM-HAADF image of EDS mapping area. The particle was tilted to [010] zone and its surface facets were determined. (d) Corresponding Ni elemental mapping. (e) Line scan signal counts across the PNS layer, whose location is shown in the STEM-HAADF image; (f) Quantitative Ni/Mn atomic ratios along the line scan. The Ni/Mn ratios are around 0.35 in bulk region, which is close to the designed value 0.33. | Figure 1. (a) low magni fi cation and (b) high resolution STEM-HAADF images of the PNS layer in a pristine particle. White arrows in (b) indicate ordered features along (20 -2) planes. Red arrows in (b) indicated Li-slabs being inserted heavy TM cations in the PNS layer. A [010] direction C 2/ m crystal structure is shown as inset map in (b). Green: Li; Blue: Ni; Purple: Mn; Red: O. (c) STEM-HAADF image of EDS mapping area. The particle was tilted to [010] zone and its surface facets were determined. (d) Corresponding Ni elemental mapping. (e) Line scan signal counts across the PNS layer, whose location is shown in the STEM-HAADF image; (f) Quantitative Ni/Mn atomic ratios along the line scan. The Ni/Mn ratios are around 0.35 in bulk region, which is close to the designed value 0.33. | |||
| low | 3 | 45 | page_footer | page_footer | docling_page_footer | docling_page_footer | p3:body_region:1 | p3:bottom_margin:column_2_of_2:white | [255, 255, 255] white | [411.19, 773.27, 153.29, 7.74] | dx.doi.org/10.1021/nl5038598 | Nano Lett. 2015, 15, 514 -522 | dx.doi.org/10.1021/nl5038598 | Nano Lett. 2015, 15, 514 -522 | ||
| low | 3 | 46 | page_footer | page_footer | docling_page_footer | docling_page_footer | p3:bottom_margin:column_2_of_2:white | [255, 255, 255] white | [306.48, 774.02, 11.95, 6.54] | 516 | 516 | |||
| low | 4 | 47 | page_header | page_header | docling_page_header | docling_page_header | p4:body_region:0 | p4:top_margin:column_1_of_2:white | [255, 255, 255] white | [60.49, 48.93, 55.9, 8.72] | Nano Letters | Nano Letters | ||
| low | 4 | 48 | page_header | page_header | docling_page_header | docling_page_header | p4:body_region:1 | p4:top_margin:column_2_of_2:colored | [238, 164, 167] colored | [537.96, 49.99, 19.47, 7.35] | Letter | Letter | ||
| low | 4 | 49 | caption | caption | outside_body_flow_caption | outside_body_flow_caption | p4:page_body:column_1_of_2:white | [255, 255, 255] white | [60.49, 426.09, 503.98, 77.89] | Figure 2. (a-d) Low magni fi cation STEM-HAADF images to show cycling induced corrosion. Cracks and pits are highlighted by red arrows. (002) surface planes show strong resistance to corrosion. e-h) [010] zone axis SAED patterns. Extra di ff raction spots appeared in cycled samples, which are highlighted by red and blue circles. Red circles indicated the formation of ordered structure. (10 -1) ordered plane is clearly seen after cycling. Blue circles come from double di ff raction. (i -l) High resolution STEM-HAADF images to show the cycling induced structure change on particle surfaces. Pristine samples (i) shows homogeneous structure from surface to bulk. Dashed lines in (j, k) highlight the thickness of the SRL. In (l), the whole areas were transformed. (m) [101] zone axis STEM-HAADF image and its fast Fourier transformation image. Blue arrows indicate the ordered features of (20 -2) planes and extra di ff raction spots. (n) [010] zone axis STEM-HAADF image to show spinel structure and I41 structure in a 45 cycled sample. | Figure 2. (a-d) Low magni fi cation STEM-HAADF images to show cycling induced corrosion. Cracks and pits are highlighted by red arrows. (002) surface planes show strong resistance to corrosion. e-h) [010] zone axis SAED patterns. Extra di ff raction spots appeared in cycled samples, which are highlighted by red and blue circles. Red circles indicated the formation of ordered structure. (10 -1) ordered plane is clearly seen after cycling. Blue circles come from double di ff raction. (i -l) High resolution STEM-HAADF images to show the cycling induced structure change on particle surfaces. Pristine samples (i) shows homogeneous structure from surface to bulk. Dashed lines in (j, k) highlight the thickness of the SRL. In (l), the whole areas were transformed. (m) [101] zone axis STEM-HAADF image and its fast Fourier transformation image. Blue arrows indicate the ordered features of (20 -2) planes and extra di ff raction spots. (n) [010] zone axis STEM-HAADF image to show spinel structure and I41 structure in a 45 cycled sample. | |||
| low | 4 | 50 | text | back_matter_heading | back_matter_heading | back_matter_heading | stop_trigger | p4:body_region:0 | p4:bottom_margin:column_1_of_2:white | [255, 255, 255] white | [60.49, 513.6, 239.99, 249.6] | Supporting Information Figure S3. Figure 1 (c -f) and Supporting Information Figure S4 show elemental distribution captured by EDS mapping of a pristine particle. In Figure 1c, the particle was tilted to [010] zone axis. As marked in Figure 1(c), fi ve surface facets are well-de fi ned. Elements mapping shows that only the (20 -2) facet possesses Ni-segregation (Figure 2d and Supporting Information Figure S4). Detailed line scan results (Figure 1e and f) reveal that Ni is the only enriched element and the Ni/Mn ratio decreases from surface into bulk. The PNS layer has a typical uniform thickness of ∼ 2 nm and can only be observed on (20 -2) surface. Since only heavy TM cations (Mn and Ni) are visible in STEM-HAADF images, as indicated by the red arrows in Figure 1b, some TM cations have substituted the Li cation octahedral sites in Lislabs. Therefore, the composition of PNS is Ni-rich but Li-poor and cannot be ascribed to C 2/ m symmetry in structure. The structural features of the PNS layer will be discussed in the following section. As the PNS layer has a similar structure with cycling induced surface reconstruction layer (SRL), when observing cycling induced SRLs on cycled particles, (20 -2) surface will be avoided. | Supporting Information Figure S3. Figure 1 (c -f) and Supporting Information Figure S4 show elemental distribution captured by EDS mapping of a pristine particle. In Figure 1c, the particle was tilted to [010] zone axis. As marked in Figure 1(c), fi ve surface facets are well-de fi ned. Elements mapping shows that only the (20 -2) facet possesses Ni-segregation (Figure 2d and Supporting Information Figure S4). Detailed line scan results (Figure 1e and f) reveal that Ni is the only enriched element and the Ni/Mn ratio decreases from surface into bulk. The PNS layer has a typical uniform thickness of ∼ 2 nm and can only be observed on (20 -2) surface. Since only heavy TM cations (Mn and Ni) are visible in STEM-HAADF images, as indicated by the red arrows in Figure 1b, some TM cations have substituted the Li cation octahedral sites in Lislabs. Therefore, the composition of PNS is Ni-rich but Li-poor and cannot be ascribed to C 2/ m symmetry in structure. The structural features of the PNS layer will be discussed in the following section. As the PNS layer has a similar structure with cycling induced surface reconstruction layer (SRL), when observing cycling induced SRLs on cycled particles, (20 -2) surface will be avoided. | |
| low | 4 | 52 | page_footer | page_footer | after_back_matter_stop | after_back_matter_stop | after_stop | p4:body_region:1 | p4:bottom_margin:column_2_of_2:white | [255, 255, 255] white | [411.19, 773.27, 153.29, 7.74] | dx.doi.org/10.1021/nl5038598 | Nano Lett. 2015, 15, 514 -522 | dx.doi.org/10.1021/nl5038598 | Nano Lett. 2015, 15, 514 -522 | |
| low | 4 | 53 | page_footer | page_footer | after_back_matter_stop | after_back_matter_stop | after_stop | p4:bottom_margin:column_2_of_2:white | [255, 255, 255] white | [306.48, 774.02, 11.95, 6.54] | 517 | 517 | ||
| low | 5 | 54 | page_header | page_header | after_back_matter_stop | after_back_matter_stop | after_stop | p5:body_region:0 | p5:top_margin:column_1_of_2:white | [255, 255, 255] white | [60.49, 48.93, 55.9, 8.72] | Nano Letters | Nano Letters | |
| low | 5 | 55 | page_header | page_header | after_back_matter_stop | after_back_matter_stop | after_stop | p5:body_region:1 | p5:top_margin:column_2_of_2:colored | [238, 164, 167] colored | [537.96, 49.99, 19.47, 7.35] | Letter | Letter | |
| low | 5 | 56 | caption | caption | after_back_matter_stop | after_back_matter_stop | after_stop | p5:page_body:column_1_of_2:white | [255, 255, 255] white | [60.49, 535.74, 503.99, 78.59] | Figure 3. (a-d) EDS mapping results from a 45 cycled LMR particle. The particle was tilted to the [010] zone axis and three surface facets were determined in (b). (e) Quantitative Ni/Mn ratios from surface and bulk positions as marked in (a); (f) line scan signal counts; (g) Quantitative Ni/ Mn atomic ratios along the line scan. The Ni/Mn ratios are around 0.26 in bulk region. (h)Low loss EELS spectra and (i) high low EELS spectra from di ff erent samples. 4.7 V bulk: spectrum collected from 4.7 V overcharged sample ' s bulk region; 100S: spectra collected from the surface of 100 cycled sample; 45S: spectra collected from the surface of 45 cycled sample; PNS: spectra collected from the Ni-rich surface of pristine sample; PS: spectra collected from pristine sample surface without Ni-rich layer; Li2O: spectrum collected from Li2O sample; Bulk: spectrum collected from pristine sample ' s bulk region. The degree of Li -K edge depression is 4.7 V bulk >100S > 45S ≈ PNS > PS. The order of Mn L3/L2 ratio is 100S > 45S > PNS ≈ PS ≈ Bulk. | Figure 3. (a-d) EDS mapping results from a 45 cycled LMR particle. The particle was tilted to the [010] zone axis and three surface facets were determined in (b). (e) Quantitative Ni/Mn ratios from surface and bulk positions as marked in (a); (f) line scan signal counts; (g) Quantitative Ni/ Mn atomic ratios along the line scan. The Ni/Mn ratios are around 0.26 in bulk region. (h)Low loss EELS spectra and (i) high low EELS spectra from di ff erent samples. 4.7 V bulk: spectrum collected from 4.7 V overcharged sample ' s bulk region; 100S: spectra collected from the surface of 100 cycled sample; 45S: spectra collected from the surface of 45 cycled sample; PNS: spectra collected from the Ni-rich surface of pristine sample; PS: spectra collected from pristine sample surface without Ni-rich layer; Li2O: spectrum collected from Li2O sample; Bulk: spectrum collected from pristine sample ' s bulk region. The degree of Li -K edge depression is 4.7 V bulk >100S > 45S ≈ PNS > PS. The order of Mn L3/L2 ratio is 100S > 45S > PNS ≈ PS ≈ Bulk. | ||
| low | 5 | 57 | text | unknown_text | after_back_matter_stop | after_back_matter_stop | after_stop | p5:body_region:0 | p5:page_body:column_1_of_2:white | [255, 255, 255] white | [60.49, 624.7, 240.0, 22.39] | surface layer ' s both structural and composition evolution upon cycling. | surface layer ' s both structural and composition evolution upon cycling. | |
| low | 5 | 60 | page_footer | page_footer | after_back_matter_stop | after_back_matter_stop | after_stop | p5:body_region:1 | p5:bottom_margin:column_2_of_2:white | [255, 255, 255] white | [411.19, 773.27, 153.29, 7.74] | dx.doi.org/10.1021/nl5038598 | Nano Lett. 2015, 15, 514 -522 | dx.doi.org/10.1021/nl5038598 | Nano Lett. 2015, 15, 514 -522 | |
| low | 5 | 61 | page_footer | page_footer | after_back_matter_stop | after_back_matter_stop | after_stop | p5:bottom_margin:column_2_of_2:white | [255, 255, 255] white | [306.48, 774.02, 11.95, 6.54] | 518 | 518 | ||
| low | 6 | 62 | page_header | page_header | after_back_matter_stop | after_back_matter_stop | after_stop | p6:body_region:0 | p6:top_margin:column_1_of_2:white | [255, 255, 255] white | [60.49, 48.93, 55.9, 8.72] | Nano Letters | Nano Letters | |
| low | 6 | 64 | text | back_matter_text | after_back_matter_stop | after_back_matter_stop | after_stop | p6:body_region:0 | p6:page_body:column_1_of_2:white | [255, 255, 255] white | [60.49, 212.55, 240.0, 528.54] | Cycling induced chemical composition change. The chemical compositions of the LMR particles after cycling were mapped by using the high e ffi cient EDS spectrometer (Figure 3a -d). In order to compare the structural and chemical composition analysis of the cycled sample with the pristine one, all the samples were tilted to the [010] zone axis (in comparison with Figure 1). Three surface facets, (002), (202) and (200), are in the edge along this orientation as indicated in Figure 3b. Quantitative EDS analysis reveals the following two points. (1) As compared with the pristine one, the SRL of the cycled sample is Ni rich along the (002), (202) and (200) facets as indicated by the Ni intensity map shown in Figure 3d, the EDS point analysis shown in Figure 3e, and the line scan pro fi le shown in Figure 3f. This is further supported by the Mn/Ni ratio as illustrated in Figure 3(g) for which the sample thickness e ff ect is normalized. (2) After cycling, the Ni concentration in the bulk lattice is decreased. This is quantitatively proved by the fact that the Ni/Mn atomic ratio for the 45 cycled sample is about 0.26 (see Figure 3(g)), which is signi fi cantly lower than the value of 0.35 for the pristine bulk sample (see Figure 1f). The observation of the formation of Ni rich SRL on the surfaces and depletion of Ni from the bulk lattice conclusively indicates that Ni migrates from the bulk to surface during the cycling of the cathode. This observation is consistent with the DFT calculation results that Ni in the Li slab has a relatively low migration barrier as compared with Li. 28 The quantitative EDS line analysis shown in Figure 3f and Supporting Information Figure S9) reveals another intriguing feature: the distribution of Mn and Ni within the thin SRL layer also shows spatial partitions, i.e., Ni-poor structure was observed in the outside edge of the SRL ( ∼ 2 nm in thickness), while Ni-rich structure was observed in the inner part of the SRL ( ∼ 6 nm in thickness). This observation probably indicates that Ni in the very outside of the particle is preferentially dissolved into the liquid electrolyte during the cycling. However, this assumption does not con fl ict with the usually seen higher Mn dissolution into electrolyte, because Ni content is much lower than that of Mn in this LMR cathode. A recent study shows that Ni dissolution can be higher than that of Mn for the Ni-rich cathode. 41 However, it has been noticed that the PNS layer (the (20 -2)) surface facet) and the SRL on the (002) remain intact during the cycling. Both (20 -2) and (002) surface facets are composed of pure cations/anions, while surface facets (200) and (202) are composed of a mixture of cations and anions. Therefore, it can be generally concluded that Ni on the surface with a mixture of cations and anions is prone to dissolve into the electrolyte, but it is not the case for the surface with a pure cations/anions. | Cycling induced chemical composition change. The chemical compositions of the LMR particles after cycling were mapped by using the high e ffi cient EDS spectrometer (Figure 3a -d). In order to compare the structural and chemical composition analysis of the cycled sample with the pristine one, all the samples were tilted to the [010] zone axis (in comparison with Figure 1). Three surface facets, (002), (202) and (200), are in the edge along this orientation as indicated in Figure 3b. Quantitative EDS analysis reveals the following two points. (1) As compared with the pristine one, the SRL of the cycled sample is Ni rich along the (002), (202) and (200) facets as indicated by the Ni intensity map shown in Figure 3d, the EDS point analysis shown in Figure 3e, and the line scan pro fi le shown in Figure 3f. This is further supported by the Mn/Ni ratio as illustrated in Figure 3(g) for which the sample thickness e ff ect is normalized. (2) After cycling, the Ni concentration in the bulk lattice is decreased. This is quantitatively proved by the fact that the Ni/Mn atomic ratio for the 45 cycled sample is about 0.26 (see Figure 3(g)), which is signi fi cantly lower than the value of 0.35 for the pristine bulk sample (see Figure 1f). The observation of the formation of Ni rich SRL on the surfaces and depletion of Ni from the bulk lattice conclusively indicates that Ni migrates from the bulk to surface during the cycling of the cathode. This observation is consistent with the DFT calculation results that Ni in the Li slab has a relatively low migration barrier as compared with Li. 28 The quantitative EDS line analysis shown in Figure 3f and Supporting Information Figure S9) reveals another intriguing feature: the distribution of Mn and Ni within the thin SRL layer also shows spatial partitions, i.e., Ni-poor structure was observed in the outside edge of the SRL ( ∼ 2 nm in thickness), while Ni-rich structure was observed in the inner part of the SRL ( ∼ 6 nm in thickness). This observation probably indicates that Ni in the very outside of the particle is preferentially dissolved into the liquid electrolyte during the cycling. However, this assumption does not con fl ict with the usually seen higher Mn dissolution into electrolyte, because Ni content is much lower than that of Mn in this LMR cathode. A recent study shows that Ni dissolution can be higher than that of Mn for the Ni-rich cathode. 41 However, it has been noticed that the PNS layer (the (20 -2)) surface facet) and the SRL on the (002) remain intact during the cycling. Both (20 -2) and (002) surface facets are composed of pure cations/anions, while surface facets (200) and (202) are composed of a mixture of cations and anions. Therefore, it can be generally concluded that Ni on the surface with a mixture of cations and anions is prone to dissolve into the electrolyte, but it is not the case for the surface with a pure cations/anions. | |
| low | 6 | 65 | text | unknown_text | after_back_matter_stop | after_back_matter_stop | after_stop | p6:body_region:0 | p6:bottom_margin:column_1_of_2:white | [255, 255, 255] white | [60.49, 743.34, 239.95, 19.86] | Compared with the PNS layer, the cycling induced SRL presents three clear di ff erences. First, the SRL occurred on all | Compared with the PNS layer, the cycling induced SRL presents three clear di ff erences. First, the SRL occurred on all | |
| low | 6 | 66 | page_header | page_header | after_back_matter_stop | after_back_matter_stop | after_stop | p6:body_region:1 | p6:top_margin:column_2_of_2:colored | [238, 164, 167] colored | [537.96, 49.99, 19.47, 7.35] | Letter | Letter | |
| low | 6 | 69 | text | back_matter_text | after_back_matter_stop | after_back_matter_stop | after_stop | p6:body_region:1 | p6:bottom_margin:column_2_of_2:white | [255, 255, 255] white | [324.45, 477.7, 240.04, 285.5] | Structure modeling of the SRL. In the literature, the structure of the SRL has been assigned to rock salt, 5,20,35 disordered rock salt 2 and spinel (including disordered-spinel/ spinel-like). 10,21,23 However, as shown in Figure 2, the SRL in LMR cathode actually exhibits an ordered structure, which rules out the rock salt and disordered rock salt structures. For the spinel structure, it can be two kinds of spinel phases: LiM2O4 spinel and M3O4 spinel. The EELS indicates existence of Li in the SRL. Thus, the LiM2O4 spinel is only discussed at this section. The M 3 O4 type spinel will be discussed in next section. Even though the experimental di ff raction patterns match with the LiM2O4-spinel, both HRTEM and high resolution STEMHAADF images (Figures 2) do not match LiM2O4-spinel, because it is evident that all the octahedral site columns were occupied by TM cations. Therefore, the SRL is more likely to be another structure. Thackeray et al. found that when Li was chemically inserted into Mn3O4, 46 LiMn3O4 will be formed with a space group I41 (the ICSD No. is 164994). Based on structure simulation, the SRL observed in the present work is indeed correspondence to the I41 structure. Combining the EDS and EELS analysis, it is estimated that the composition of the SRL is close to LiM2O3 (M=Mn and Ni). This conclusion is supported by the comparing the experimental HRTEM and STEM-HAADF images with that of the calculated structure of rock salt, disordered rock salt, spinel and I41 as shown in Figure 4. Evidentially, the tetragonal I41 structure is the best one | Structure modeling of the SRL. In the literature, the structure of the SRL has been assigned to rock salt, 5,20,35 disordered rock salt 2 and spinel (including disordered-spinel/ spinel-like). 10,21,23 However, as shown in Figure 2, the SRL in LMR cathode actually exhibits an ordered structure, which rules out the rock salt and disordered rock salt structures. For the spinel structure, it can be two kinds of spinel phases: LiM2O4 spinel and M3O4 spinel. The EELS indicates existence of Li in the SRL. Thus, the LiM2O4 spinel is only discussed at this section. The M 3 O4 type spinel will be discussed in next section. Even though the experimental di ff raction patterns match with the LiM2O4-spinel, both HRTEM and high resolution STEMHAADF images (Figures 2) do not match LiM2O4-spinel, because it is evident that all the octahedral site columns were occupied by TM cations. Therefore, the SRL is more likely to be another structure. Thackeray et al. found that when Li was chemically inserted into Mn3O4, 46 LiMn3O4 will be formed with a space group I41 (the ICSD No. is 164994). Based on structure simulation, the SRL observed in the present work is indeed correspondence to the I41 structure. Combining the EDS and EELS analysis, it is estimated that the composition of the SRL is close to LiM2O3 (M=Mn and Ni). This conclusion is supported by the comparing the experimental HRTEM and STEM-HAADF images with that of the calculated structure of rock salt, disordered rock salt, spinel and I41 as shown in Figure 4. Evidentially, the tetragonal I41 structure is the best one | |
| low | 6 | 70 | page_footer | page_footer | after_back_matter_stop | after_back_matter_stop | after_stop | p6:body_region:1 | p6:bottom_margin:column_2_of_2:white | [255, 255, 255] white | [411.19, 773.27, 153.29, 7.74] | dx.doi.org/10.1021/nl5038598 | Nano Lett. 2015, 15, 514 -522 | dx.doi.org/10.1021/nl5038598 | Nano Lett. 2015, 15, 514 -522 | |
| low | 6 | 71 | page_footer | page_footer | after_back_matter_stop | after_back_matter_stop | after_stop | p6:bottom_margin:column_2_of_2:white | [255, 255, 255] white | [306.48, 774.02, 11.95, 6.54] | 519 | 519 | ||
| low | 7 | 72 | page_header | page_header | after_back_matter_stop | after_back_matter_stop | after_stop | p7:top_margin:column_1_of_2:white | [255, 255, 255] white | [60.49, 48.93, 55.9, 8.72] | Nano Letters | Nano Letters | ||
| low | 7 | 73 | page_header | page_header | after_back_matter_stop | after_back_matter_stop | after_stop | p7:top_margin:column_2_of_2:colored | [238, 164, 167] colored | [537.96, 49.99, 19.47, 7.35] | Letter | Letter | ||
| low | 7 | 74 | caption | caption | after_back_matter_stop | after_back_matter_stop | after_stop | p7:page_body:column_1_of_2:white | [255, 255, 255] white | [60.49, 427.51, 503.95, 17.9] | Figure 4. Comparison between experimental results and simulation results of di ff erent crystal models for the SRL from the [010] zone axis. I41 structure matches best in the four crystal models. | Figure 4. Comparison between experimental results and simulation results of di ff erent crystal models for the SRL from the [010] zone axis. I41 structure matches best in the four crystal models. | ||
| low | 7 | 75 | caption | caption | after_back_matter_stop | after_back_matter_stop | after_stop | p7:page_body:column_1_of_2:white | [255, 255, 255] white | [60.49, 668.71, 503.98, 38.4] | Figure 5. Schematic diagram to show cycling induced surface layer evolution. At left side, the pristine particle has a C 2/ m structure and PNS layers are located at (20 -2) surface planes. After cycling, due to Ni 2+ migration from bulk to surface, Mn 2+ surface aggregation and Li + depletion in surface layer, SRL is developed on particle surface except the PNS. The structure of surface layer transforms from original C 2/ m into I41 and fi nally developed spinel structure due to progressive TM enrichment and Li depletion. I41 structure is the main phase in the SRL. | Figure 5. Schematic diagram to show cycling induced surface layer evolution. At left side, the pristine particle has a C 2/ m structure and PNS layers are located at (20 -2) surface planes. After cycling, due to Ni 2+ migration from bulk to surface, Mn 2+ surface aggregation and Li + depletion in surface layer, SRL is developed on particle surface except the PNS. The structure of surface layer transforms from original C 2/ m into I41 and fi nally developed spinel structure due to progressive TM enrichment and Li depletion. I41 structure is the main phase in the SRL. | ||
| low | 7 | 78 | page_footer | page_footer | after_back_matter_stop | after_back_matter_stop | after_stop | p7:bottom_margin:column_2_of_2:white | [255, 255, 255] white | [411.19, 773.27, 153.29, 7.74] | dx.doi.org/10.1021/nl5038598 | Nano Lett. 2015, 15, 514 -522 | dx.doi.org/10.1021/nl5038598 | Nano Lett. 2015, 15, 514 -522 | ||
| low | 7 | 79 | page_footer | page_footer | after_back_matter_stop | after_back_matter_stop | after_stop | p7:bottom_margin:column_2_of_2:white | [254, 254, 254] white | [306.48, 774.02, 11.95, 6.54] | 520 | 520 | ||
| low | 8 | 80 | page_header | page_header | after_back_matter_stop | after_back_matter_stop | after_stop | p8:body_region:0 | p8:top_margin:column_1_of_2:white | [255, 255, 255] white | [60.49, 48.93, 55.9, 8.72] | Nano Letters | Nano Letters | |
| low | 8 | 81 | text | back_matter_text | after_back_matter_stop | after_back_matter_stop | after_stop | p8:body_region:0 | p8:page_body:column_1_of_2:white | [255, 255, 255] white | [60.49, 69.37, 240.0, 153.63] | Above experimental observation is also consistently supported by the density functional theory (DFT) calculation of the lattice energy, which indicates that the I41 has the lowest lattice energy. In order to understand the relative stability of rock salt, disordered rock salt and I41 crystal models, we calculated the lattice energy of each phase using the Vienna ab initio simulation package within the framework of DFT. 47 The three structures contain the same Li:Ni:Mn:O proportion, i.e. 0.67:0.43:0.9:2. Our calculations show that lattice energy of I41structure is about 0.10 eV lower than that of disordered rock salt structure and 0.11 eV lower than that of rock salt structure for the Li 0.67 Mn0.9Ni0.43O2 molecule. Hence, I41 phase is more stable than the rock salt and disordered rock salt at the composition of Li 0.67 Ni0.43Mn0.9O2. | Above experimental observation is also consistently supported by the density functional theory (DFT) calculation of the lattice energy, which indicates that the I41 has the lowest lattice energy. In order to understand the relative stability of rock salt, disordered rock salt and I41 crystal models, we calculated the lattice energy of each phase using the Vienna ab initio simulation package within the framework of DFT. 47 The three structures contain the same Li:Ni:Mn:O proportion, i.e. 0.67:0.43:0.9:2. Our calculations show that lattice energy of I41structure is about 0.10 eV lower than that of disordered rock salt structure and 0.11 eV lower than that of rock salt structure for the Li 0.67 Mn0.9Ni0.43O2 molecule. Hence, I41 phase is more stable than the rock salt and disordered rock salt at the composition of Li 0.67 Ni0.43Mn0.9O2. | |
| low | 8 | 82 | text | back_matter_text | after_back_matter_stop | after_back_matter_stop | after_stop | p8:body_region:0 | p8:page_body:column_1_of_2:white | [255, 255, 255] white | [60.49, 224.03, 240.0, 240.85] | Depending on the Li, TM and O composition, di ff erent phases can be formed. For example, Li2MnO3 adopts a monoclinic C 2/ m structure; LiMnO2 and Li(Ni0.5Mn0.5)O2 adopt the trigonal R 3 ̅ m structure; LiMn2O4 adopts a cubic Fd 3 ̅ m spinel structure, which could become Mn 3 O4 spinel with the complete depletion of Li. Thus, Li-M-O material should have a most stable structure with a given composition. As convinced by our EDS and EELS analysis, the cycling induced SRL is a TM-rich and Li-poor structure, which indicates the formation of SRL involves a progressive enrichment of TM and Li depletion upon cycling. In many cases, composition change of a material will trigger structural transformation. Therefore, we believe the structure change of the SRL is driven by its composition change. As shown in Figure 2n, we noticed a Lidepletion M3O4-spinel was developed outside of the I41 structure, which indicates the I41 structure can fi nally transformed into M3O4-spinel with further depletion of Li content. Thus, a phase transformation sequence for the surface layer is proposed as C 2/ m → I41 → M3O4-spinel. This conclusion is also supported by Figure 2l which shows the outer layer of cycled sample (100S) exhibits more clear spinelfeatured structure. | Depending on the Li, TM and O composition, di ff erent phases can be formed. For example, Li2MnO3 adopts a monoclinic C 2/ m structure; LiMnO2 and Li(Ni0.5Mn0.5)O2 adopt the trigonal R 3 ̅ m structure; LiMn2O4 adopts a cubic Fd 3 ̅ m spinel structure, which could become Mn 3 O4 spinel with the complete depletion of Li. Thus, Li-M-O material should have a most stable structure with a given composition. As convinced by our EDS and EELS analysis, the cycling induced SRL is a TM-rich and Li-poor structure, which indicates the formation of SRL involves a progressive enrichment of TM and Li depletion upon cycling. In many cases, composition change of a material will trigger structural transformation. Therefore, we believe the structure change of the SRL is driven by its composition change. As shown in Figure 2n, we noticed a Lidepletion M3O4-spinel was developed outside of the I41 structure, which indicates the I41 structure can fi nally transformed into M3O4-spinel with further depletion of Li content. Thus, a phase transformation sequence for the surface layer is proposed as C 2/ m → I41 → M3O4-spinel. This conclusion is also supported by Figure 2l which shows the outer layer of cycled sample (100S) exhibits more clear spinelfeatured structure. | |
| low | 8 | 85 | page_header | page_header | after_back_matter_stop | after_back_matter_stop | after_stop | p8:body_region:1 | p8:top_margin:column_2_of_2:colored | [238, 164, 167] colored | [537.96, 49.99, 19.47, 7.35] | Letter | Letter | |
| low | 8 | 86 | text | back_matter_text | after_back_matter_stop | after_back_matter_stop | after_stop | p8:body_region:1 | p8:page_body:column_2_of_2:white | [255, 255, 255] white | [324.45, 69.37, 240.04, 335.76] | indeed correlated to the SRL on the surface of each particle. This conclusion is supported by the following points. (1) Gradual migration of Ni from bulk lattice to the surface will lead to gradual depletion of Ni from the bulk lattice and directly leads to capacity fading. Furthermore, with a decreasing Ni content, the Mn -Ni interaction becomes weaker which will result in material destabilization. 13 (2) Dissolution of the cations, especially Ni along crystal facets that are terminated with a mixture of both cation and anion, leads to corrosion of cathode particle and consequently the capacity fading. Chen eat al have demonstrated that for spinel LiMn1.5Ni0.5O4 cathode materials, particle morphology has a dominant e ff ect on spinel transport properties, indicating the great role of surface structure on the stability of the particle in liquid. 48 (3) The SRL is a TM rich layer by which the Li position in the Li slab was gradually occupied by the TM caions following a certain di ff usion path, which has been discussed in details based on theoretical calculations. 1,18,32 According to a recent simulation by Ceder et al., 2 the SRL will results in increasing barrier for Li migration, therefore contributing to the voltage fade. (4) The formation of patches of Li depleted spinel at the very surface of the particle essentially cut o ff the Li transport path, making the Li in the particle not accessible and therefore leading to both voltage and capacity fading. (5) The observation of the high stability of pure cation terminated facets typically such as (002) and (20 -2) in the electrolyte appears to be rather intriguing for designing particle against corrosion if these type of surfaces are enlarged. However, these surfaces will probably block the Li transport path. Therefore, the contradictory role of this type of surfaces in the particle need to be optimized. | indeed correlated to the SRL on the surface of each particle. This conclusion is supported by the following points. (1) Gradual migration of Ni from bulk lattice to the surface will lead to gradual depletion of Ni from the bulk lattice and directly leads to capacity fading. Furthermore, with a decreasing Ni content, the Mn -Ni interaction becomes weaker which will result in material destabilization. 13 (2) Dissolution of the cations, especially Ni along crystal facets that are terminated with a mixture of both cation and anion, leads to corrosion of cathode particle and consequently the capacity fading. Chen eat al have demonstrated that for spinel LiMn1.5Ni0.5O4 cathode materials, particle morphology has a dominant e ff ect on spinel transport properties, indicating the great role of surface structure on the stability of the particle in liquid. 48 (3) The SRL is a TM rich layer by which the Li position in the Li slab was gradually occupied by the TM caions following a certain di ff usion path, which has been discussed in details based on theoretical calculations. 1,18,32 According to a recent simulation by Ceder et al., 2 the SRL will results in increasing barrier for Li migration, therefore contributing to the voltage fade. (4) The formation of patches of Li depleted spinel at the very surface of the particle essentially cut o ff the Li transport path, making the Li in the particle not accessible and therefore leading to both voltage and capacity fading. (5) The observation of the high stability of pure cation terminated facets typically such as (002) and (20 -2) in the electrolyte appears to be rather intriguing for designing particle against corrosion if these type of surfaces are enlarged. However, these surfaces will probably block the Li transport path. Therefore, the contradictory role of this type of surfaces in the particle need to be optimized. | |
| low | 8 | 88 | section_header | unknown_text | after_back_matter_stop | after_back_matter_stop | after_stop | p8:body_region:1 | p8:page_body:column_2_of_2:white | [255, 255, 255] white | [324.45, 680.04, 121.77, 23.65] | ■ ASSOCIATED CONTENT | ■ ASSOCIATED CONTENT | |
| low | 8 | 89 | section_header | unknown_text | after_back_matter_stop | after_back_matter_stop | after_stop | p8:body_region:1 | p8:page_body:column_2_of_2:white | [255, 255, 255] white | [324.45, 705.69, 113.4, 12.62] | * S Supporting Information | * S Supporting Information | |
| low | 8 | 91 | page_footer | page_footer | after_back_matter_stop | after_back_matter_stop | after_stop | p8:body_region:1 | p8:bottom_margin:column_2_of_2:white | [255, 255, 255] white | [411.19, 773.27, 153.29, 7.74] | dx.doi.org/10.1021/nl5038598 | Nano Lett. 2015, 15, 514 -522 | dx.doi.org/10.1021/nl5038598 | Nano Lett. 2015, 15, 514 -522 | |
| low | 8 | 92 | page_footer | page_footer | after_back_matter_stop | after_back_matter_stop | after_stop | p8:bottom_margin:column_2_of_2:white | [255, 255, 255] white | [306.48, 774.02, 11.95, 6.54] | 521 | 521 | ||
| low | 9 | 93 | page_header | page_header | after_back_matter_stop | after_back_matter_stop | after_stop | p9:body_region:0 | p9:top_margin:left:white | [255, 255, 255] white | [60.49, 48.93, 55.9, 8.72] | Nano Letters | Nano Letters | |
| low | 9 | 94 | page_header | page_header | after_back_matter_stop | after_back_matter_stop | after_stop | p9:top_margin:right:colored | [238, 164, 167] colored | [537.96, 49.99, 19.47, 7.35] | Letter | Letter | ||
| low | 9 | 95 | section_header | unknown_text | after_back_matter_stop | after_back_matter_stop | after_stop | p9:body_region:0 | p9:top_margin:left:white | [255, 255, 255] white | [60.49, 58.18, 125.07, 23.65] | ■ AUTHOR INFORMATION | ■ AUTHOR INFORMATION | |
| low | 9 | 96 | list_item | reference | after_back_matter_stop | after_back_matter_stop | after_stop | p9:page_body:right_crossing:white | [255, 255, 255] white | [324.45, 68.99, 239.97, 18.61] | Li, H. H.; Yabuuchi, N.; Meng, Y. S.; Kumar, S.; Breger, J.; Grey, C. P.; Shao-Horn, Y. Chem. Mater. 2007 , 19 , 2551 -2565. | Li, H. H.; Yabuuchi, N.; Meng, Y. S.; Kumar, S.; Breger, J.; Grey, C. P.; Shao-Horn, Y. Chem. Mater. 2007 , 19 , 2551 -2565. | ||
| low | 9 | 97 | section_header | metadata | after_back_matter_stop | after_back_matter_stop | after_stop | p9:body_region:0 | p9:page_body:left:white | [255, 255, 255] white | [60.49, 84.08, 97.03, 8.29] | Corresponding Authors | Corresponding Authors | |
| low | 9 | 98 | list_item | metadata | after_back_matter_stop | after_back_matter_stop | after_stop | p9:body_region:0 | p9:page_body:left:white | [255, 255, 255] white | [60.49, 92.47, 130.11, 12.07] | E-mail: Jiguang.zhang@pnnl.gov. | E-mail: Jiguang.zhang@pnnl.gov. | |
| low | 9 | 99 | list_item | reference | after_back_matter_stop | after_back_matter_stop | after_stop | p9:page_body:right_crossing:white | [255, 255, 255] white | [324.45, 89.0, 239.98, 18.61] | Jarvis, K. A.; Deng, Z. Q.; Allard, L. F.; Manthiram, A.; Ferreira, P. J. Chem. Mater. 2011 , 23 , 3614 -3621. | Jarvis, K. A.; Deng, Z. Q.; Allard, L. F.; Manthiram, A.; Ferreira, P. J. Chem. Mater. 2011 , 23 , 3614 -3621. | ||
| low | 9 | 100 | list_item | metadata | after_back_matter_stop | after_back_matter_stop | after_stop | p9:body_region:0 | p9:page_body:left:white | [255, 255, 255] white | [60.49, 103.47, 140.43, 12.07] | E-mail: Chongmin.wang@pnnl.gov. | E-mail: Chongmin.wang@pnnl.gov. | |
| low | 9 | 101 | section_header | unknown_text | after_back_matter_stop | after_back_matter_stop | after_stop | p9:body_region:0 | p9:page_body:left:white | [255, 255, 255] white | [60.49, 120.36, 23.72, 8.29] | Notes | Notes | |
| low | 9 | 102 | list_item | reference | after_back_matter_stop | after_back_matter_stop | after_stop | p9:page_body:right_crossing:white | [255, 255, 255] white | [324.45, 109.01, 239.98, 18.07] | Lin, F.; Markus, I. M.; Nordlund, D.; Weng, T. C.; Asta, M. D.; Xin, H. L.; Doeff, M. M. Nat. Commun. 2014 , 5 , 3529. | Lin, F.; Markus, I. M.; Nordlund, D.; Weng, T. C.; Asta, M. D.; Xin, H. L.; Doeff, M. M. Nat. Commun. 2014 , 5 , 3529. | ||
| low | 9 | 103 | text | unknown_text | after_back_matter_stop | after_back_matter_stop | after_stop | p9:body_region:0 | p9:page_body:left:white | [255, 255, 255] white | [60.49, 132.02, 201.38, 8.8] | The authors declare no competing fi nancial interest. | The authors declare no competing fi nancial interest. | |
| low | 9 | 104 | section_header | back_matter_heading | after_back_matter_stop | after_back_matter_stop | after_stop | p9:body_region:0 | p9:page_body:left:white | [255, 255, 255] white | [60.49, 142.48, 114.79, 23.65] | ■ ACKNOWLEDGMENTS | ■ ACKNOWLEDGMENTS | |
| low | 9 | 105 | list_item | reference | after_back_matter_stop | after_back_matter_stop | after_stop | p9:page_body:right_crossing:white | [255, 255, 255] white | [324.46, 148.56, 240.04, 19.04] | Xu, B.; Fell, C. R.; Chi, M. F.; Meng, Y. S. Energy Environ. Sci. 2011 , 4 , 2223 -2233. | Xu, B.; Fell, C. R.; Chi, M. F.; Meng, Y. S. Energy Environ. Sci. 2011 , 4 , 2223 -2233. | ||
| low | 9 | 106 | list_item | reference | after_back_matter_stop | after_back_matter_stop | after_stop | p9:page_body:right_crossing:white | [255, 255, 255] white | [324.46, 129.03, 240.0, 18.56] | Boulineau, A.; Simonin, L.; Colin, J. F.; Bourbon, C.; Patoux, S. Nano Lett. 2013 , 13 , 3857 -63. | Boulineau, A.; Simonin, L.; Colin, J. F.; Bourbon, C.; Patoux, S. Nano Lett. 2013 , 13 , 3857 -63. | ||
| low | 9 | 107 | text | back_matter_text | after_back_matter_stop | after_back_matter_stop | after_stop | p9:body_region:0 | p9:page_body:left_crossing:white | [255, 255, 255] white | [60.49, 168.7, 239.99, 228.77] | We appreciate the bene fi cial discussion of Dr. Ping Lu of Sandia National Laboratory during the course of this work. This work was supported by the Assistant Secretary for Energy E ffi ciency and Renewable Energy, Offi ce of Vehicle Technologies of the U.S. Department of Energy under Contract No. DE-AC02-05CH11231, Subcontract No. 6951379 under the Batteries for Advanced Transportation Technologies (BATT) Program. The high spatial resolution and high e ffi ciency EDS analysis described in this paper is supported by the Laboratory Directed Research and Development Program as part of the Chemical Imaging Initiative at Paci fi c Northwest National Laboratory (PNNL). The work was conducted in the William R. Wiley Environmental Molecular Sciences Laboratory (EMSL), a national scienti fi c user facility sponsored by DOE ' s Offi ce of Biological and Environmental Research and located at PNNL. PNNL is operated by Battelle for the Department of Energy under Contract DE-AC05-76RLO1830. The Materials synthesis was carried out at Argonne National Laboratory, which is operated for the U.S. Department of Energy by University of Chicago Argonne, LLC, under contract DE-AC0Z-06CH11357. | We appreciate the bene fi cial discussion of Dr. Ping Lu of Sandia National Laboratory during the course of this work. This work was supported by the Assistant Secretary for Energy E ffi ciency and Renewable Energy, Offi ce of Vehicle Technologies of the U.S. Department of Energy under Contract No. DE-AC02-05CH11231, Subcontract No. 6951379 under the Batteries for Advanced Transportation Technologies (BATT) Program. The high spatial resolution and high e ffi ciency EDS analysis described in this paper is supported by the Laboratory Directed Research and Development Program as part of the Chemical Imaging Initiative at Paci fi c Northwest National Laboratory (PNNL). The work was conducted in the William R. Wiley Environmental Molecular Sciences Laboratory (EMSL), a national scienti fi c user facility sponsored by DOE ' s Offi ce of Biological and Environmental Research and located at PNNL. PNNL is operated by Battelle for the Department of Energy under Contract DE-AC05-76RLO1830. The Materials synthesis was carried out at Argonne National Laboratory, which is operated for the U.S. Department of Energy by University of Chicago Argonne, LLC, under contract DE-AC0Z-06CH11357. | |
| low | 9 | 108 | list_item | reference | after_back_matter_stop | after_back_matter_stop | after_stop | p9:page_body:right_crossing:white | [255, 255, 255] white | [324.45, 239.01, 240.0, 18.56] | Fell, C. R.; Qian, D. N.; Carroll, K. J.; Chi, M. F.; Jones, J. L.; Meng, Y. S. Chem. Mater. 2013 , 25 , 1621 -1629. | Fell, C. R.; Qian, D. N.; Carroll, K. J.; Chi, M. F.; Jones, J. L.; Meng, Y. S. Chem. Mater. 2013 , 25 , 1621 -1629. | ||
| low | 9 | 109 | list_item | reference | after_back_matter_stop | after_back_matter_stop | after_stop | p9:page_body:right_crossing:white | [255, 255, 255] white | [324.45, 218.51, 240.0, 19.1] | Qian, D.; Xu, B.; Chi, M.; Meng, Y. S. Phys. Chem. Chem. Phys. 2014 , 16 , 14665 -14668. | Qian, D.; Xu, B.; Chi, M.; Meng, Y. S. Phys. Chem. Chem. Phys. 2014 , 16 , 14665 -14668. | ||
| low | 9 | 110 | list_item | reference | after_back_matter_stop | after_back_matter_stop | after_stop | p9:page_body:right_crossing:white | [255, 255, 255] white | [324.45, 259.02, 239.97, 18.56] | Yu, H.; Ishikawa, R.; So, Y. G.; Shibata, N.; Kudo, T.; Zhou, H.; Ikuhara, Y. Angew. Chem., Int. Ed. Engl. 2013 , 52 , 5969 -73. | Yu, H.; Ishikawa, R.; So, Y. G.; Shibata, N.; Kudo, T.; Zhou, H.; Ikuhara, Y. Angew. Chem., Int. Ed. Engl. 2013 , 52 , 5969 -73. | ||
| low | 9 | 111 | list_item | reference | after_back_matter_stop | after_back_matter_stop | after_stop | p9:page_body:right_crossing:white | [255, 255, 255] white | [324.45, 279.04, 239.99, 28.53] | Gu, M.; Belharouak, I.; Genc, A.; Wang, Z.; Wang, D.; Amine, K.; Gao, F.; Zhou, G.; Thevuthasan, S.; Baer, D. R.; Zhang, J. G.; Browning, N. D.; Liu, J.; Wang, C. Nano Lett. 2012 , 12 , 5186 -91. | Gu, M.; Belharouak, I.; Genc, A.; Wang, Z.; Wang, D.; Amine, K.; Gao, F.; Zhou, G.; Thevuthasan, S.; Baer, D. R.; Zhang, J. G.; Browning, N. D.; Liu, J.; Wang, C. Nano Lett. 2012 , 12 , 5186 -91. | ||
| low | 9 | 112 | list_item | reference | after_back_matter_stop | after_back_matter_stop | after_stop | p9:page_body:right_crossing:white | [255, 255, 255] white | [324.45, 309.03, 240.0, 27.94] | Rana, J.; Stan, M.; Kloepsch, R.; Li, J.; Schumacher, G.; Welter, E.; Zizak, I.; Banhart, J.; Winter, M. Adv. Energy Mater. 2014 , 4 , 1300998. | Rana, J.; Stan, M.; Kloepsch, R.; Li, J.; Schumacher, G.; Welter, E.; Zizak, I.; Banhart, J.; Winter, M. Adv. Energy Mater. 2014 , 4 , 1300998. | ||
| low | 9 | 113 | list_item | reference | after_back_matter_stop | after_back_matter_stop | after_stop | p9:page_body:right_crossing:white | [255, 255, 255] white | [324.45, 339.02, 240.01, 28.59] | Li, B.; Gu, M.; Nie, Z. M.; Shao, Y. Y.; Luo, Q. T.; Wei, X. L.; Li, X. L.; Xiao, J.; Wang, C. M.; Sprenlde, V.; Wang, W. Nano Lett. 2013 , 13 , 1330 -1335. | Li, B.; Gu, M.; Nie, Z. M.; Shao, Y. Y.; Luo, Q. T.; Wei, X. L.; Li, X. L.; Xiao, J.; Wang, C. M.; Sprenlde, V.; Wang, W. Nano Lett. 2013 , 13 , 1330 -1335. | ||
| low | 9 | 114 | list_item | reference | after_back_matter_stop | after_back_matter_stop | after_stop | p9:page_body:right_crossing:white | [255, 255, 255] white | [324.46, 169.0, 240.03, 28.59] | Gu, M.; Belharouak, I.; Zheng, J. M.; Wu, H. M.; Xiao, J.; Genc, A.; Amine, K.; Thevuthasan, S.; Baer, D. R.; Zhang, J. G.; Browning, N. D.; Liu, J.; Wang, C. M. ACS Nano 2013 , 7 , 760 -767. | Gu, M.; Belharouak, I.; Zheng, J. M.; Wu, H. M.; Xiao, J.; Genc, A.; Amine, K.; Thevuthasan, S.; Baer, D. R.; Zhang, J. G.; Browning, N. D.; Liu, J.; Wang, C. M. ACS Nano 2013 , 7 , 760 -767. | ||
| low | 9 | 115 | list_item | reference | after_back_matter_stop | after_back_matter_stop | after_stop | p9:page_body:right_crossing:white | [255, 255, 255] white | [324.46, 389.02, 240.01, 18.56] | Breger, J.; Meng, Y. S.; Hinuma, Y.; Kumar, S.; Kang, K.; ShaoHorn, Y.; Ceder, G.; Grey, C. P. Chem. Mater. 2006 , 18 , 4768 -4781. | Breger, J.; Meng, Y. S.; Hinuma, Y.; Kumar, S.; Kang, K.; ShaoHorn, Y.; Ceder, G.; Grey, C. P. Chem. Mater. 2006 , 18 , 4768 -4781. | ||
| low | 9 | 116 | list_item | reference | after_back_matter_stop | after_back_matter_stop | after_stop | p9:page_body:right_crossing:white | [255, 255, 255] white | [324.46, 368.52, 240.04, 19.1] | Yabuuchi, N.; Yoshii, K.; Myung, S. T.; Nakai, I.; Komaba, S. J. Am. Chem. Soc. 2011 , 133 , 4404 -4419. | Yabuuchi, N.; Yoshii, K.; Myung, S. T.; Nakai, I.; Komaba, S. J. Am. Chem. Soc. 2011 , 133 , 4404 -4419. | ||
| low | 9 | 117 | list_item | reference | after_back_matter_stop | after_back_matter_stop | after_stop | p9:page_body:right_crossing:white | [255, 255, 255] white | [324.46, 198.5, 240.0, 19.09] | Zheng, J.; Gu, M.; Xiao, J.; Zuo, P.; Wang, C.; Zhang, J. G. Nano Lett. 2013 , 13 , 3824 -30. | Zheng, J.; Gu, M.; Xiao, J.; Zuo, P.; Wang, C.; Zhang, J. G. Nano Lett. 2013 , 13 , 3824 -30. | ||
| low | 9 | 118 | list_item | reference | after_back_matter_stop | after_back_matter_stop | after_stop | p9:body_region:0 | p9:page_body:left_crossing:white | [255, 255, 255] white | [60.49, 424.53, 239.95, 19.04] | Kang, K. S.; Meng, Y. S.; Breger, J.; Grey, C. P.; Ceder, G. Science 2006 , 311 , 977 -980. | Kang, K. S.; Meng, Y. S.; Breger, J.; Grey, C. P.; Ceder, G. Science 2006 , 311 , 977 -980. | |
| low | 9 | 119 | section_header | back_matter_heading | after_back_matter_stop | after_back_matter_stop | after_stop | p9:body_region:0 | p9:page_body:left:white | [255, 255, 255] white | [60.49, 399.13, 73.27, 23.65] | ■ REFERENCES | ■ REFERENCES | |
| low | 9 | 120 | list_item | reference | after_back_matter_stop | after_back_matter_stop | after_stop | p9:page_body:right_crossing:white | [255, 255, 255] white | [324.46, 409.04, 240.01, 28.53] | Armstrong, A. R.; Holzapfel, M.; Novak, P.; Johnson, C. S.; Kang, S. H.; Thackeray, M. M.; Bruce, P. G. J. Am. Chem. Soc. 2006 , 128 , 8694 -8698. | Armstrong, A. R.; Holzapfel, M.; Novak, P.; Johnson, C. S.; Kang, S. H.; Thackeray, M. M.; Bruce, P. G. J. Am. Chem. Soc. 2006 , 128 , 8694 -8698. | ||
| low | 9 | 121 | list_item | reference | after_back_matter_stop | after_back_matter_stop | after_stop | p9:body_region:0 | p9:page_body:left_crossing:white | [255, 255, 255] white | [60.49, 444.54, 239.95, 19.04] | Lee, J.; Urban, A.; Li, X.; Su, D.; Hautier, G.; Ceder, G. Science 2014 , 343 , 519 -22. | Lee, J.; Urban, A.; Li, X.; Su, D.; Hautier, G.; Ceder, G. Science 2014 , 343 , 519 -22. | |
| low | 9 | 122 | list_item | reference | after_back_matter_stop | after_back_matter_stop | after_stop | p9:page_body:right_crossing:white | [255, 255, 255] white | [324.46, 438.54, 240.0, 19.04] | Qian, D.; Xu, B.; Chi, M.; Meng, Y. S. Phys. Chem. Chem. Phys. 2014 , 16 , 14665 -8. | Qian, D.; Xu, B.; Chi, M.; Meng, Y. S. Phys. Chem. Chem. Phys. 2014 , 16 , 14665 -8. | ||
| low | 9 | 123 | list_item | reference | after_back_matter_stop | after_back_matter_stop | after_stop | p9:body_region:0 | p9:page_body:left_crossing:white | [255, 255, 255] white | [60.49, 464.5, 240.0, 19.1] | Meng, Y. S.; Arroyo-de Dompablo, M. E. Acc. Chem. Res. 2013 , 46 , 1171 -1180. | Meng, Y. S.; Arroyo-de Dompablo, M. E. Acc. Chem. Res. 2013 , 46 , 1171 -1180. | |
| low | 9 | 124 | list_item | reference | after_back_matter_stop | after_back_matter_stop | after_stop | p9:page_body:right_crossing:white | [255, 255, 255] white | [324.45, 458.56, 239.98, 19.04] | Guilmard, M.; Croguennec, L.; Denux, D.; Delmas, C. Chem. Mater. 2003 , 15 , 4476 -4483. | Guilmard, M.; Croguennec, L.; Denux, D.; Delmas, C. Chem. Mater. 2003 , 15 , 4476 -4483. | ||
| low | 9 | 125 | list_item | reference | after_back_matter_stop | after_back_matter_stop | after_stop | p9:body_region:0 | p9:page_body:left_crossing:white | [255, 255, 255] white | [60.49, 484.51, 240.0, 18.44] | Xu, J.; Lee, D. H.; Meng, Y. S. Funct. Mater. Lett. 2013 , 6 , 1330001. | Xu, J.; Lee, D. H.; Meng, Y. S. Funct. Mater. Lett. 2013 , 6 , 1330001. | |
| low | 9 | 126 | list_item | reference | after_back_matter_stop | after_back_matter_stop | after_stop | p9:page_body:right_crossing:white | [255, 255, 255] white | [324.45, 478.99, 240.0, 28.59] | Gu, M.; Genc, A.; Belharouak, I.; Wang, D. P.; Amine, K.; Thevuthasan, S.; Baer, D. R.; Zhang, J. G.; Browning, N. D.; Liu, J.; Wang, C. M. Chem. Mater. 2013 , 25 , 2319 -2326. | Gu, M.; Genc, A.; Belharouak, I.; Wang, D. P.; Amine, K.; Thevuthasan, S.; Baer, D. R.; Zhang, J. G.; Browning, N. D.; Liu, J.; Wang, C. M. Chem. Mater. 2013 , 25 , 2319 -2326. | ||
| low | 9 | 127 | list_item | reference | after_back_matter_stop | after_back_matter_stop | after_stop | p9:body_region:0 | p9:page_body:left_crossing:white | [255, 255, 255] white | [60.49, 505.01, 239.96, 28.59] | Nam, K. W.; Bak, S. M.; Hu, E. Y.; Yu, X. Q.; Zhou, Y. N.; Wang, X. J.; Wu, L. J.; Zhu, Y. M.; Chung, K. Y.; Yang, X. Q. Adv. Funct. Mater. 2013 , 23 , 1047 -1063. | Nam, K. W.; Bak, S. M.; Hu, E. Y.; Yu, X. Q.; Zhou, Y. N.; Wang, X. J.; Wu, L. J.; Zhu, Y. M.; Chung, K. Y.; Yang, X. Q. Adv. Funct. Mater. 2013 , 23 , 1047 -1063. | |
| low | 9 | 128 | list_item | reference | after_back_matter_stop | after_back_matter_stop | after_stop | p9:page_body:right_crossing:white | [255, 255, 255] white | [324.45, 508.55, 240.04, 19.04] | Zhang, X. F.; Xu, R.; Li, L.; Yu, C.; Ren, Y.; Belharouak, I. J. Electrochem. Soc. 2013 , 160 , A1079 -A1083. | Zhang, X. F.; Xu, R.; Li, L.; Yu, C.; Ren, Y.; Belharouak, I. J. Electrochem. Soc. 2013 , 160 , A1079 -A1083. | ||
| low | 9 | 129 | list_item | reference | after_back_matter_stop | after_back_matter_stop | after_stop | p9:page_body:right:white | [255, 255, 255] white | [328.48, 525.96, 206.3, 11.61] | Hillyard, S.; Silcox, J. Ultramicroscopy 1995 , 58 , 6 -17. | Hillyard, S.; Silcox, J. Ultramicroscopy 1995 , 58 , 6 -17. | ||
| low | 9 | 130 | list_item | reference | after_back_matter_stop | after_back_matter_stop | after_stop | p9:body_region:0 | p9:page_body:left_crossing:white | [255, 255, 255] white | [60.49, 535.01, 239.98, 18.56] | Sun, Y. K.; Myung, S. T.; Park, B. C.; Prakash, J.; Belharouak, I.; Amine, K. Nat. Mater. 2009 , 8 , 320 -4. | Sun, Y. K.; Myung, S. T.; Park, B. C.; Prakash, J.; Belharouak, I.; Amine, K. Nat. Mater. 2009 , 8 , 320 -4. | |
| low | 9 | 131 | list_item | reference | after_back_matter_stop | after_back_matter_stop | after_stop | p9:page_body:right_crossing:white | [255, 255, 255] white | [324.45, 538.54, 240.0, 19.04] | Kirkland, E. J.; Loane, R. F.; Silcox, J. Ultramicroscopy 1987 , 23 , 77 -96. | Kirkland, E. J.; Loane, R. F.; Silcox, J. Ultramicroscopy 1987 , 23 , 77 -96. | ||
| low | 9 | 132 | list_item | reference | after_back_matter_stop | after_back_matter_stop | after_stop | p9:body_region:0 | p9:page_body:left_crossing:white | [255, 255, 255] white | [60.49, 555.02, 239.94, 18.56] | Ceder, G.; Chiang, Y. M.; Sadoway, D. R.; Aydinol, M. K.; Jang, Y. I.; Huang, B. Nature 1998 , 392 , 694 -696. | Ceder, G.; Chiang, Y. M.; Sadoway, D. R.; Aydinol, M. K.; Jang, Y. I.; Huang, B. Nature 1998 , 392 , 694 -696. | |
| low | 9 | 133 | list_item | reference | after_back_matter_stop | after_back_matter_stop | after_stop | p9:body_region:0 | p9:page_body:left:white | [255, 255, 255] white | [64.46, 572.0, 212.14, 11.61] | Tarascon, J. M.; Armand, M. Nature 2001 , 414 , 359 -67. | Tarascon, J. M.; Armand, M. Nature 2001 , 414 , 359 -67. | |
| low | 9 | 134 | list_item | reference | after_back_matter_stop | after_back_matter_stop | after_stop | p9:page_body:right_crossing:white | [255, 255, 255] white | [324.45, 559.04, 240.0, 18.56] | Lu, Z. H.; Beaulieu, L. Y.; Donaberger, R. A.; Thomas, C. L.; Dahn, J. R. J. Electrochem. Soc. 2002 , 149 , A778 -A791. | Lu, Z. H.; Beaulieu, L. Y.; Donaberger, R. A.; Thomas, C. L.; Dahn, J. R. J. Electrochem. Soc. 2002 , 149 , A778 -A791. | ||
| low | 9 | 135 | list_item | reference | after_back_matter_stop | after_back_matter_stop | after_stop | p9:body_region:0 | p9:page_body:left_crossing:white | [255, 255, 255] white | [60.49, 584.52, 239.98, 19.04] | Marom, R.; Amalraj, S. F.; Leifer, N.; Jacob, D.; Aurbach, D. J. Mater. Chem. 2011 , 21 , 9938 -9954. | Marom, R.; Amalraj, S. F.; Leifer, N.; Jacob, D.; Aurbach, D. J. Mater. Chem. 2011 , 21 , 9938 -9954. | |
| low | 9 | 136 | list_item | reference | after_back_matter_stop | after_back_matter_stop | after_stop | p9:page_body:right_crossing:white | [255, 255, 255] white | [324.45, 578.51, 240.0, 19.1] | Noh, H.-J.; Myung, S.-T.; Lee, Y. J.; Sun, Y.-K. Chem. Mater. 2014 , 26 , 5973 -5979. | Noh, H.-J.; Myung, S.-T.; Lee, Y. J.; Sun, Y.-K. Chem. Mater. 2014 , 26 , 5973 -5979. | ||
| low | 9 | 137 | list_item | reference | after_back_matter_stop | after_back_matter_stop | after_stop | p9:body_region:0 | p9:page_body:left_crossing:white | [255, 255, 255] white | [60.49, 605.02, 239.94, 18.56] | Thackeray, M. M.; Johnson, C. S.; Vaughey, J. T.; Li, N.; Hackney, S. A. J. Mater. Chem. 2005 , 15 , 2257 -2267. | Thackeray, M. M.; Johnson, C. S.; Vaughey, J. T.; Li, N.; Hackney, S. A. J. Mater. Chem. 2005 , 15 , 2257 -2267. | |
| low | 9 | 138 | list_item | reference | after_back_matter_stop | after_back_matter_stop | after_stop | p9:page_body:right_crossing:white | [255, 255, 255] white | [324.45, 598.53, 240.0, 19.04] | Pearson, D. H.; Ahn, C. C.; Fultz, B. Phys. Rev. B 1993 , 47 , 8471 -8478. | Pearson, D. H.; Ahn, C. C.; Fultz, B. Phys. Rev. B 1993 , 47 , 8471 -8478. | ||
| low | 9 | 139 | list_item | reference | after_back_matter_stop | after_back_matter_stop | after_stop | p9:page_body:right:white | [255, 255, 255] white | [328.48, 615.99, 234.08, 11.61] | Wang, Z. L.; Yin, J. S.; Jiang, Y. D. Micron 2000 , 31 , 571 -80. | Wang, Z. L.; Yin, J. S.; Jiang, Y. D. Micron 2000 , 31 , 571 -80. | ||
| low | 9 | 140 | list_item | reference | after_back_matter_stop | after_back_matter_stop | after_stop | p9:body_region:0 | p9:page_body:left_crossing:white | [255, 255, 255] white | [60.49, 625.04, 240.0, 28.53] | Zheng, J.; Gu, M.; Genc, A.; Xiao, J.; Xu, P.; Chen, X.; Zhu, Z.; Zhao, W.; Pullan, L.; Wang, C.; Zhang, J. G. Nano Lett. 2014 , 14 , 2628 -35. | Zheng, J.; Gu, M.; Genc, A.; Xiao, J.; Xu, P.; Chen, X.; Zhu, Z.; Zhao, W.; Pullan, L.; Wang, C.; Zhang, J. G. Nano Lett. 2014 , 14 , 2628 -35. | |
| low | 9 | 141 | list_item | reference | after_back_matter_stop | after_back_matter_stop | after_stop | p9:page_body:right_crossing:white | [255, 255, 255] white | [324.45, 628.52, 240.0, 19.1] | Ohzuku, T.; Kitagawa, M.; Hirai, T. J. Electrochem. Soc. 1990 , 137 , 769 -775. | Ohzuku, T.; Kitagawa, M.; Hirai, T. J. Electrochem. Soc. 1990 , 137 , 769 -775. | ||
| low | 9 | 142 | list_item | reference | after_back_matter_stop | after_back_matter_stop | after_stop | p9:body_region:0 | p9:page_body:left_crossing:white | [255, 255, 255] white | [60.49, 654.54, 239.92, 19.03] | Kam, K. C.; Mehta, A.; Heron, J. T.; Doeff, M. M. J. Electrochem. Soc. 2012 , 159 , A1383 -A1392. | Kam, K. C.; Mehta, A.; Heron, J. T.; Doeff, M. M. J. Electrochem. Soc. 2012 , 159 , A1383 -A1392. | |
| low | 9 | 143 | list_item | reference | after_back_matter_stop | after_back_matter_stop | after_stop | p9:page_body:right_crossing:white | [255, 255, 255] white | [324.45, 649.02, 240.02, 18.56] | Hwang, S.; Chang, W.; Kim, S. M.; Su, D.; Kim, D. H.; Lee, J. Y.; Chung, K. Y.; Stach, E. A. Chem. Mater. 2014 , 26 , 1084 -1092. | Hwang, S.; Chang, W.; Kim, S. M.; Su, D.; Kim, D. H.; Lee, J. Y.; Chung, K. Y.; Stach, E. A. Chem. Mater. 2014 , 26 , 1084 -1092. | ||
| low | 9 | 144 | list_item | reference | after_back_matter_stop | after_back_matter_stop | after_stop | p9:body_region:0 | p9:page_body:left_crossing:white | [255, 255, 255] white | [60.49, 674.55, 239.94, 19.04] | Kim, D.; Croy, J. R.; Thackeray, M. M. Electrochem. Commun. 2013 , 36 , 103 -106. | Kim, D.; Croy, J. R.; Thackeray, M. M. Electrochem. Commun. 2013 , 36 , 103 -106. | |
| low | 9 | 145 | list_item | reference | after_back_matter_stop | after_back_matter_stop | after_stop | p9:page_body:right_crossing:white | [255, 255, 255] white | [324.45, 669.03, 240.02, 18.56] | Thackeray, M. M.; David, W. I. F.; Bruce, P. G.; Goodenough, J. B. Mater. Res. Bull. 1983 , 18 , 461 -472. | Thackeray, M. M.; David, W. I. F.; Bruce, P. G.; Goodenough, J. B. Mater. Res. Bull. 1983 , 18 , 461 -472. | ||
| low | 9 | 146 | list_item | reference | after_back_matter_stop | after_back_matter_stop | after_stop | p9:page_body:right:white | [255, 255, 255] white | [328.48, 686.0, 207.79, 11.61] | Kresse, G.; Hafner, J. Phys. Rev. B 1993 , 47 , 558 -561. | Kresse, G.; Hafner, J. Phys. Rev. B 1993 , 47 , 558 -561. | ||
| low | 9 | 147 | list_item | reference | after_back_matter_stop | after_back_matter_stop | after_stop | p9:body_region:0 | p9:page_body:left_crossing:white | [255, 255, 255] white | [60.49, 691.96, 240.01, 20.99] | Guan, D.; Jeevarajan, J. A.; Wang, Y. Nanoscales 2011 , 3 , 1465 -1469. | Guan, D.; Jeevarajan, J. A.; Wang, Y. Nanoscales 2011 , 3 , 1465 -1469. | |
| low | 9 | 148 | list_item | reference | after_back_matter_stop | after_back_matter_stop | after_stop | p9:page_body:right_crossing:white | [255, 255, 255] white | [324.45, 698.53, 239.98, 19.04] | Hai, B.; Shukla, A. K.; Duncan, H.; Chen, G. Y. J. Mater. Chem. A 2013 , 1 , 759 -769. | Hai, B.; Shukla, A. K.; Duncan, H.; Chen, G. Y. J. Mater. Chem. A 2013 , 1 , 759 -769. | ||
| low | 9 | 149 | list_item | reference | after_back_matter_stop | after_back_matter_stop | after_stop | p9:body_region:0 | p9:page_body:left_crossing:white | [255, 255, 255] white | [60.49, 714.52, 239.96, 19.1] | Lu, Z. H.; MacNeil, D. D.; Dahn, J. R. Electrochem Solid St. 2001 , 4 , A191 -A194. | Lu, Z. H.; MacNeil, D. D.; Dahn, J. R. Electrochem Solid St. 2001 , 4 , A191 -A194. | |
| low | 9 | 150 | list_item | reference | after_back_matter_stop | after_back_matter_stop | after_stop | p9:body_region:0 | p9:page_body:left:white | [255, 255, 255] white | [64.46, 731.98, 214.38, 11.61] | Wang, Y.; Cao, G. Z. Adv. Mater. 2008 , 20 , 2251 -2269. | Wang, Y.; Cao, G. Z. Adv. Mater. 2008 , 20 , 2251 -2269. | |
| low | 9 | 151 | list_item | reference | after_back_matter_stop | after_back_matter_stop | after_stop | p9:body_region:0 | p9:bottom_margin:left_crossing:white | [255, 255, 255] white | [60.49, 744.99, 239.94, 19.05] | Meng, Y. S.; Ceder, G.; Grey, C. P.; Yoon, W. S.; Jiang, M.; Bre ́ ger, J.; Shao-Horn, Y. Chem. Mater. 2005 , 17 , 2386 -2394. | Meng, Y. S.; Ceder, G.; Grey, C. P.; Yoon, W. S.; Jiang, M.; Bre ́ ger, J.; Shao-Horn, Y. Chem. Mater. 2005 , 17 , 2386 -2394. | |
| low | 9 | 152 | page_footer | page_footer | after_back_matter_stop | after_back_matter_stop | after_stop | p9:bottom_margin:left_crossing:white | [255, 255, 255] white | [306.48, 774.02, 11.95, 6.54] | 522 | 522 | ||
| low | 9 | 153 | page_footer | page_footer | after_back_matter_stop | after_back_matter_stop | after_stop | p9:bottom_margin:right:white | [255, 255, 255] white | [411.19, 773.27, 153.29, 7.74] | dx.doi.org/10.1021/nl5038598 | Nano Lett. 2015, 15, 514 -522 | dx.doi.org/10.1021/nl5038598 | Nano Lett. 2015, 15, 514 -522 |