1
2
3
4
5
6
7
original.pdf layout_review.html excluded_blocks.html final_body_blocks.tsv layout_blocks.tsv
绿色编号 = 最终进入正文的段落顺序;蓝色虚线 = section heading 边界。每个条目同时显示 Docling 页内原序、新页内顺序和识别栏位;排序只在同页内调整,不拆分文本块。

| # | page | Docling 页内原序 | 新页内顺序 | global layout order | zone | column | region | bbox | text |
|---|---|---|---|---|---|---|---|---|---|
| 1 | 1 | 7 | 6 | 5 | page_body | column_2_of_2 | p1:body_region:1 | [217.32, 145.43, 345.53, 40.36] | Tongchao Liu 1,10 , Jiajie Liu 2,10 , Luxi Li 3,10 , Lei Yu 4 , Jiecheng Diao 5 , Tao Zhou 4 , Shunning Li 2 , Alvin Dai 1 , Wenguang Zhao 2 , Shenyang Xu 2 , Yang Ren 3,9 , Liguang Wang 3 , Tianpin Wu 3 , Rui Qi 2 , Yinguo Xiao 2 , Jiaxin Zheng 2 , Wonsuk Cha 3 , Ross Harder 3 , Ian Robinson 5,6 , Jianguo Wen 4 , Jun Lu 1 ✉ , Feng Pan 2 ✉ & Khalil Amine 1,7,8 ✉ |
| 2 | 1 | 9 | 8 | 7 | page_body | column_1_of_2 | p1:body_region:0 | [50.5, 210.98, 70.02, 7.0] | Check for updates |
| 3 | 1 | 8 | 9 | 8 | page_body | column_2_of_2 | p1:body_region:1 | [217.32, 210.27, 344.32, 229.3] | Li- and Mn-rich (LMR) cathode materials that utilize both cation and anion redox can yield substantial increases in battery energy density 1-3 . However, although voltage decay issues cause continuous energy loss and impede commercialization, the prerequisite driving force for this phenomenon remains a mystery 3-6 Here, with in situ nanoscale sensitive coherent X-ray diffraction imaging techniques, we reveal that nanostrain and lattice displacement accumulate continuously during operation of the cell. Evidence shows that this effect is the driving force for both structure degradation and oxygen loss, which trigger the well-known rapid voltage decay in LMR cathodes. By carrying out micro- to macro-length characterizations that span atomic structure, the primary particle, multiparticle and electrode levels, we demonstrate that the heterogeneous nature of LMR cathodes inevitably causes pernicious phase displacement/strain, which cannot be eliminated by conventional doping or coating methods. We therefore propose mesostructural design as a strategy to mitigate lattice displacement and inhomogeneous electrochemical/ structural evolutions, thereby achieving stable voltage and capacity profiles. These findings highlight the significance of lattice strain/displacement in causing voltage decay and will inspire a wave of efforts to unlock the potential of the broad-scale commercialization of LMR cathode materials. |
| 4 | 1 | 10 | 10 | 9 | page_body | column_1_of_2 | p1:body_region:0 | [39.69, 468.81, 256.69, 104.41] | Although several prevailing theories have been established for voltage fade, including transition metal (TM) migration, TM valence state reduction and irreversible phase transitions, fade has eventually been attributed to thermodynamic instability of lattice oxygen and to oxygen release 7-11 . Previous research efforts have also sought diverse solutions to premeditatively enhance lattice oxygen stability; however, the effectiveness of these strategies is limited and this problem remains unresolved so far 12-15 . This predicament raises the suspicion of whether thermodynamic instability is the governing prerequisite for voltage decay in the Li- and Mn-rich (LMR) cathode. |
| 5 | 1 | 12 | 11 | 10 | page_body | column_1_of_2 | p1:body_region:0 | [39.69, 575.19, 256.75, 105.53] | In conventional intercalation cathodes, Li-ion (Li + ) movement in/out of the host framework will drive dynamic structural evolution, which directly affects structure stability and the electrochemical profile 16-18 . Unfortunately, uneven Li + (de)intercalation and heterogeneous electrochemical reactions often occur in these cathodes, leading to non-equilibrium structural dynamics at both the macroscopic and microscopic levels 19-21 . The former is manifested as the anisotropic volume variation and bulk mechanical strain, which have been broadly viewed as the root cause of mechanical degradation, such as secondary particle cracking 22,23 . The latter contributes to nanoscale strain with less detectable lattice |
| 6 | 1 | 11 | 12 | 11 | page_body | column_2_of_2 | p1:body_region:1 | [306.14, 467.69, 256.62, 84.03] | displacement 24 , in which the destructive effects on topical structure stability remain unclear. This is particularly important for the LMR cathode because its heterogeneous structure is composed of two structurally coherent nanodomains (LiTMO2 and Li 2 MnO3), which are electrochemically activated in separate voltage ranges with different redox chemistries 25-27 . It is such heterogeneous structural dynamics of nanodomains that determine the global generation of nanoscale strain, which can substantially alter the structural stability and aggravate oxygen release. |
| 7 | 1 | 13 | 13 | 12 | page_body | column_2_of_2 | p1:body_region:1 | [306.14, 554.81, 256.71, 125.91] | Despite its fundamental importance, lattice displacement and nanoscale strain are probably the least understood structural properties in battery materials. Owing to technical limits faced in the past, characterization tools could not penetrate into nanoscale regimes, preventing the observation of lattice displacement and analysis of nanoscale strain 28 . It is even more challenging to monitor the spatial strain evolution under operando conditions 20,29,30 . Clearly, building a mechanistic link between nanoscale structure dynamics and electrochemical properties requires systematic investigations spanning multiple length scales, which have the benefit of unifying the previous electrochemical degradation mechanism of LMR cathodes and guiding effective approaches to mitigating voltage fade. |
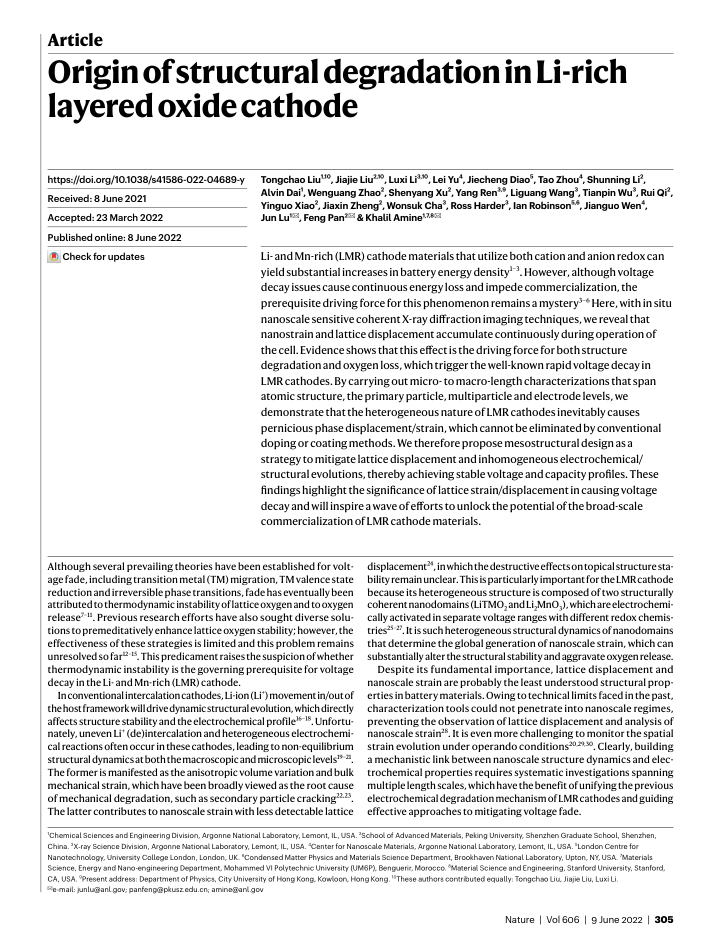
| 8 | 2 | 79 | 13 | 27 | body_zone | column_1_of_2 | p2:body_region:0 | [39.69, 501.06, 256.7, 158.16] | A representative LMR cathode with Li 1.2 Ni0.13 Mn0.54 Co0.13 O2 was synthesized by a classical sol-gel method 27 . Its morphology and composition details are described in the Methods and Extended Data Fig. 1a-f. The X-ray powder diffraction measurement (Fig. 1a) shows identical results to those reported in the literature 26,27 . Characteristic super-reflections present in the 2 θ region 1.4-2° correspond to Li/Mn ordering in the TM slabs (Li 2 MnO3-like phase). Detailed structure information can be found in Extended Data Table 1. Aberration-corrected scanning transmission electron microscopy (AC-STEM) was applied to directly visualize the spatial distribution of LiTMO 2 and Li2MnO3 domains. As shown in Fig. 1c-e, it is clear that a typical layered structure is composed of two types of bright spot arrangement. LiTMO 2 domains are three-dimensionally incorporated into the Li 2 MnO3 lattice without obvious interphase boundaries, indicating that these two phases are randomly mixed and share the coherent lattice structure. |
| 9 | 2 | 80 | 14 | 28 | bottom_margin | column_1_of_2 | p2:body_region:0 | [39.69, 662.31, 256.66, 82.91] | The electrochemical profile of the LMR cathode shows a high discharge capacity of 273 mAh g -1 but also rapid voltage fade and capacity loss concurrently during cycles (Fig. 1b) 31,32 . Notably, two distinct electrochemical stages at different voltage ranges were observed from the first charge profile (Extended Data Fig. 2a, b). Stage 1 is attributed to the activation of LiTMO2 domains associated with the oxidation of Ni and Co ions 33 . Stage 2, at a plateau voltage over 4.47 V, corresponds to the activation of Li2MnO3 domains, in which lattice oxygen is oxidized, usually accompanied by |
| 10 | 2 | 81 | 83 | 97 | body_zone | column_2_of_2 | p2:body_region:1 | [306.14, 478.44, 256.68, 30.28] | oxygen release 34,35 . The galvanostatic intermittent titration technique (GITT, Extended Data Fig. 2c, d) further confirms the differential electrochemical activities of these two structurally coherent domains. |
| 11 | 2 | 83 | 84 | 98 | body_zone | column_2_of_2 | p2:body_region:1 | [306.14, 511.81, 256.78, 179.66] | It is argued that oxygen-related gas stems from the activation of thermodynamically unstable Li 2 MnO3 domains 33,36 . Paradoxically, recent results from density functional theory (DFT) calculation demonstrate that oxygen release is thermodynamically unfavourable in the initial delithiation of the pure Li 2 MnO3 37,38 . To clarify the uncertainty shrouding oxygen release, we carefully measure the gas evolution of Li 2 MnO3 using differential electrochemical mass spectrometry (DEMS), in which oxygen-related gas is absent at the initial activation of Li 2 MnO3 around 4.5 V (less than 20% delithiation) and starts to be detected at over 20% delithiation of Li2MnO3 (Extended Data Fig. 3a-e). This result provides direct evidence that the activation of pure Li 2 MnO3 material is not the root cause of oxygen release. Consequently, the oxygen release mechanism of the LMR cathode cannot be solely attributed to the activation of domains of Li 2 MnO3 and its thermodynamic instability. The interaction between Li 2MnO3 and LiTMO2, which will lead to non-equilibrium structural responses, is critical for oxygen release, but it seems to have been overlooked previously and has rarely been investigated due to the characterization limit. |
| 12 | 2 | 85 | 86 | 100 | bottom_margin | column_2_of_2 | p2:body_region:1 | [306.14, 726.81, 256.67, 18.41] | Bragg coherent X-ray diffraction imaging (BCDI) is an indispensable tool to visualize structural, morphological and lattice strain information in |
| 13 | 3 | 1 | 60 | 160 | bottom_margin | column_1_of_2 | [39.69, 714.94, 256.67, 30.28] | electrode materials 24,39,40 . In situ BCDI measurements were performed to monitor lattice displacement and analyse strain evolution of the LMR primary particle during electrochemical reactions. The experimental | |
| 14 | 3 | 2 | 234 | 334 | bottom_margin | column_2_of_2 | [306.14, 716.06, 256.6, 29.16] | set-up and data analysis are illustrated in the Methods. Henceforth in this work, we will refer to images of this lattice displacement as generic 'strain', although it is technically an integral of strain 24 . | |
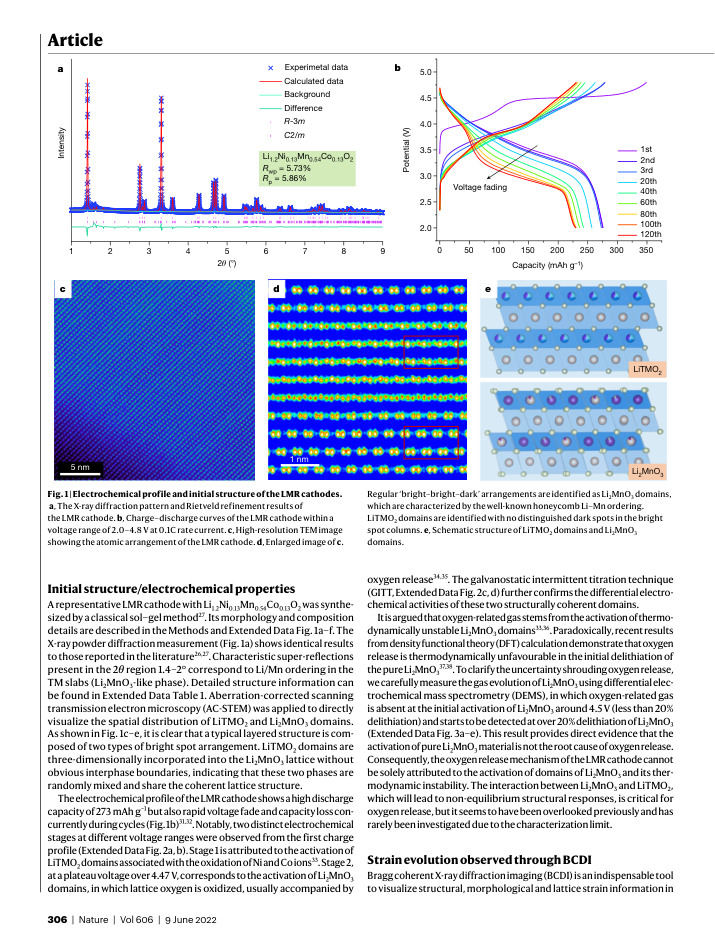
| 15 | 4 | 79 | 34 | 369 | page_body | column_1_of_2 | p4:body_region:0 | [39.69, 404.31, 256.74, 244.16] | In Fig. 2a, to demonstrate the spatial lattice evolution, the reconstructed LMR primary particle is displayed as three-dimensional cross-section images. In the pristine stage (Fig. 2b), we observed the concurrent appearance of both compressive and tensile strain. We believe these initial strains are due to local Li aggregation and vacancies caused by the high-temperature sintering process. The initial strain gradually disappears with initial delithiation as rearrangement of Li occupancies in Li layers occurs (Fig. 2c). When entering the first voltage slope around 3.9 V (Fig. 2d), a tensile strain begins to present itself on the particle surface. As discussed above, the initial Li extraction predominately occurs in the LiTMO 2 domains and results in local lattice expansion. The lattice expansion is partly confined by the inactive Li 2 MnO3, which results in tensile strain at nanoscale. The tensile strain occurs preferentially near the particle surface area, which makes sense as Li extraction starts there. With continuous Li extraction, the tensile strain gradually accumulates and extends into the interior of the particle (Fig. 2e-h). At the end of stage 1 (4.43 V), in which almost all LiTMO2 domains are fully delithiated, the electrostatic repulsion between oxygen layers reached the maximum, resulting in the existence of tensile strain in the entire particle (Fig. 2i). Therefore, undergoing such inhomogeneous Li concentration and accumulated tensile strain severely affects the structural stability of the composite LMR cathodes, which may trigger the decomposition of Li2MnO3 domains. |
| 16 | 4 | 80 | 35 | 370 | bottom_margin | column_1_of_2 | p4:body_region:0 | [39.69, 651.56, 256.69, 93.66] | Interestingly, the lattice strain evolution reverses on entering stage 2. Figure 2j shows that the tensile strain started to decrease at 4.46 V, which is considered the starting voltage of the Li 2MnO3 domain activation and the onset of O 2 release. To verify this, in situ DEMS was carried out to measure the gas generation during the first charge. Figure 2m shows that oxygen-related gas did not evolve in stage 1. On entering stage 2, onset of the O 2 and CO 2 signals were simultaneously observed, which is consistent with the strain changes mentioned above 41 . The overall tensile strain gradually decreased with oxygen release in |
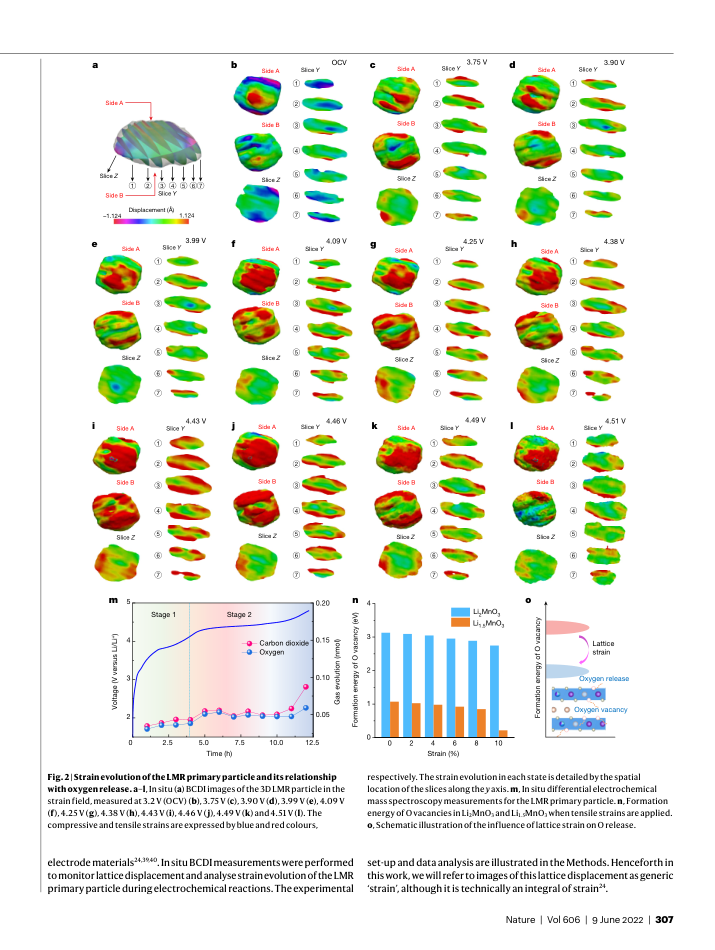
| 17 | 4 | 81 | 82 | 417 | page_body | column_2_of_2 | p4:body_region:1 | [306.14, 326.57, 253.71, 56.49] | particles and the response of individual crystals, which are typically not visible in conventional X-ray diffraction. Bright spots in the left column show initial multicrystal diffraction corresponding to tens of particles. D 1 , D 2 and D 3 correspond to three lattice distances. c , Ex situ HEXRD of the LMR cathode measured at different potentials. The peak marked by * comes from the polytetrafluoroethylene binder. |
| 18 | 4 | 82 | 83 | 418 | page_body | column_2_of_2 | p4:body_region:1 | [306.14, 404.31, 256.64, 125.91] | stage 2 (Fig. 2k, l), until the particles disappeared from the detection field over 4.51 V. As a consequence, the correlation between lattice strain evolution and oxygen release is naturally established. The inhomogeneous electrochemical kinetics of two domains results in the global existence of tensile strain in the coherent lattice and tremendous inhomogeneity in the Li + concentration, which will accelerate the decomposition of Li 2 MnO3 and trigger oxygen release. After oxygen release, the confined lattice expansion relaxes and in turn leads to decrease in lattice strain. This argument is further supported by the results of the DFT calculation. Figure 2n, o indicates that the energy barriers to remove lattice oxygen will be significantly reduced when the increased lattice strain is applied to the Li2MnO3 domains. |
| 19 | 4 | 84 | 85 | 420 | bottom_margin | column_2_of_2 | p4:body_region:1 | [306.14, 565.56, 256.68, 180.63] | Systematic structure characterization at multilength scales was performed to investigate LMR structure evolution during the first cycle (Fig. 3a) and link lattice displacement/nanostrain with electrochemical reaction. The in situ coherent X-ray multicrystal diffraction (CMCD) technique was initially applied to monitor minuscule LMR phase evolutions during operando operation 41 . This technique provides unique observations that lie between macroscopic and microscopic views and which fill the gap between conventional X-ray diffraction and BCDI. In Fig. 3b, the image captured at the open circuit voltage (OCV) shows a single ring composed of sequential bright diffraction spots (D 1 ), which correspond to c axis reflections of tens of primary particles. As single-phase reaction in LiTMO 2 domains occurs below 4.47 V, no obvious Debye-Scherrer ring changes occur. At 4.472 V, when oxygen release begins, a bright diffraction spot appears at a smaller angle (D 2 ), which suggests that part of a particle undergoes lattice expansion with oxygen release. This reaction is attributable to activation of Li2MnO3 domains and leads to the relaxation of the confined lattice. The D 2 |
| 20 | 5 | 34 | 9 | 429 | bottom_margin | column_1_of_2 | [39.69, 662.31, 256.64, 82.91] | ring intensity increases between the oxygen redox plateau and the complete charge until reaching a maximum at 4.8 V; meanwhile, the original powder ring (D 1 ) weakens as the new powder ring intensifies. These CMCD results clearly show inhomogeneous lattice expansion in the LMR cathode during the first charge. In stage 1 (below 4.472 V), due to the surrounding inactive Li 2 MnO3 domains, the lattice expansion is partly confined and only presents one diffraction ring. Such an inhomogeneous structure evolution of two domains is the primary | |
| 21 | 5 | 35 | 36 | 456 | page_body | column_2_of_2 | p5:body_region:0 | [306.14, 662.31, 256.65, 61.41] | cause of the tensile strain observed in the BCDI images. As tensile strain gradually reaches the limit, Li 2 MnO3 domains struggle with the imposed lattice strain and the Li + concentration imbalance, which subsequently triggers Li 2 MnO3 decomposition. The confined lattice expansion is released naturally with activation of the Li 2 MnO3 domains, leading to relaxation of the tensile strain. |
| 22 | 5 | 37 | 37 | 457 | bottom_margin | column_2_of_2 | p5:body_region:0 | [306.14, 726.81, 256.56, 19.38] | During discharge, reflections in CMCD images convert back to a single diffraction ring (D 1 ) via sequential converse structure transitions. |
| 23 | 6 | 33 | 11 | 469 | page_body | column_1_of_2 | p6:body_region:0 | [39.69, 307.56, 256.71, 179.66] | Interestingly, in addition to D 2 and D 1 rings, another weak diffraction ring (D 3 ) is visualized at an even smaller angle at the start of discharge. This diffraction ring can be indexed to the (101) crystal plane of Li 2 Mn2O4, which is considered to be the phase formed by over-lithiation of spinel Li x Mn2O4. This observation implies that TM migration to Li layers occurs with oxygen release and the Li x Mn2O4 spinel-like phase forms during the first charge. The D 3 diffraction ring only appeared in the first 10 min of discharge (versus a total of 10 h discharge time), which suggests Li 2 Mn2O4 is a kinetic-dependent intermediate phase. In this sense, we infer that Li x Mn2O4-like spinel domains probably concentrate on particle surfaces that are momentarily over-lithiated due to the high surface Li-ion concentration and poor Li diffusion of the surface when discharge initiates. As lithium ions gradually migrate to the bulk, the over-lithiated Li 2 Mn2O4 gradually change to LiMn 2 O4, for which the diffraction ring is very close to D 1 and D 2 . Thus, the D 3 diffraction ring accordingly disappears with surface Li + concentration equilibrium. |
| 24 | 6 | 34 | 12 | 470 | bottom_margin | column_1_of_2 | p6:body_region:0 | [39.69, 490.31, 256.74, 254.91] | Concurrently, high-energy in situ and ex situ X-ray diffraction was conducted to investigate macroscopic structural evolution. Figure 3c and Extended Data Fig. 4a, b show a (003) peak shift towards lower diffraction angles before 4.45 V, which is associated with lattice expansion induced by LiTMO 2 domains. When charged to 4.45 V, obvious (003) peak broadening propagates, indicating that the confined lattice expansion is released with decomposition of Li2MnO3 domains. These statistical observations of structure evolution are consistent with the appearance of the second diffraction ring (D 2 ) in the CMCD images. At the same time, the disappearance of the superlattice peak over 4.5 V suggests that TM migration must occur with oxygen release, and TM ordering is broken. This argument is further supported by ex situ extended X-ray absorption fine structure (EXAFS) and the fitting results. Extended Data Fig. 4c-e and Extended Data Table 2 show that the coordination number of Mn-O decreases, but that of Mn-TM increases accordingly, suggesting that lattice strain accumulation will trigger TM migration and oxygen release. More importantly, the broadening and weakening of a series of peaks are found to be mainly related to the c axis, such as (003), (104), (107) and (108) peaks (Fig. 3c and Extended Data Fig. 4a). The oriented peak broadening is due to more inhomogeneous lattice changes occurring mainly along the c axis during charge/discharge, which further confirmed that strain evolution stems from the heterogeneous nature of the LMR cathode. |
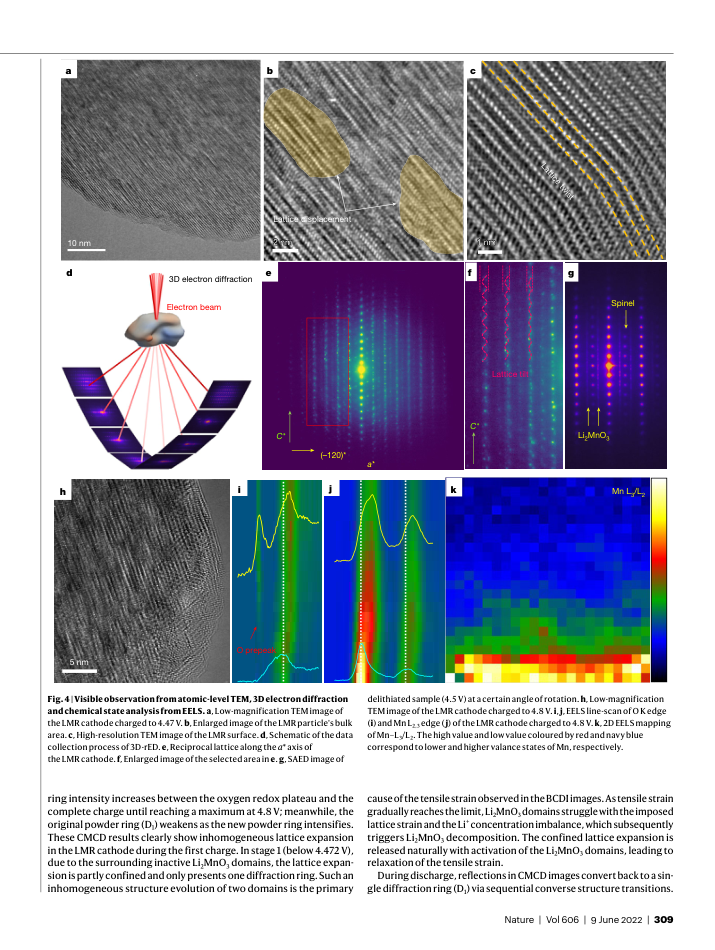
| 25 | 6 | 37 | 39 | 497 | page_body | column_2_of_2 | p6:body_region:1 | [306.14, 329.06, 256.75, 136.66] | Transmission electron microscopy (TEM), three-dimensional (3D) rotation electron diffraction (3D-rED) and electron energy loss spectroscopy (EELS) were performed on delithiated samples to investigate lattice displacement and nanostructure evolution. As mentioned, inhomogeneous electrochemical activities and structure evolution result in nanoscale strain. At micro scales, strain is manifested as lattice displacement, which can be captured by high-resolution TEM (HRTEM). Figure 4a-c and Extended Data Fig. 5 show that, although a layered structure is maintained at 4.47 V, obvious surface and bulk lattice displacements are present. Lattices in the marked areas are deformed significantly. These displacements occur predominantly on surfaces with constant lattice twists (Fig. 4c), which can be attributed to concentrated surface strain. |
| 26 | 6 | 38 | 40 | 498 | page_body | column_2_of_2 | p6:body_region:1 | [306.14, 468.81, 256.62, 158.16] | During stage 2, continuous delithiation is accompanied by oxygen release and Li 2 MnO3 domain activation. Identical observations were carried out to track these changes after Li 2 MnO3 activation. Extended Data Fig. 6a-m shows that, besides lattice displacement, a phase transition from a layered structure to the spinel phase occurs in this stage (4.5 V). Lattice evolution at larger scales was investigated by 3D-rED in reciprocal space (Fig. 4d and Extended Data Fig. 7) 42 . Reconstructed discrete reciprocal lattices (Fig. 4e, f and Extended Data Fig. 8a, b) clearly show twisted reflections along the c axis, which could be attributed to the lattice displacement observed in the HRTEM. Figure 4g and Extended Data Fig. 8c-g show selected area electron diffraction with a typical layered structure, weak Li 2 MnO3 reflections and a new reflection corresponding to the spinel lattice. This verifies that severe lattice strain triggers TM migration and structure transition from the layered phase to the spinel phase, which agrees with the structure evolution captured by CMCD. |
| 27 | 6 | 39 | 41 | 499 | bottom_margin | column_2_of_2 | p6:body_region:1 | [306.14, 630.06, 256.68, 115.16] | TEM combined with EELS was used to precisely probe the structural and chemical variation of the fully delithiated sample (4.8 V). Figure 4h and Extended Data Fig. 9a, b confirm the structure transitions, especially on the particle surface. Clear reconstruction of surface layers with spinel and rock-salt phases provides direct evidence of TM migration and irreversible phase transition after oxygen release. The O K edge and Mn L2,3 EELS line profiles were stacked in Fig. 4i, j and Extended Data Fig. 9c from the bulk to surface. The O K edge pre-peak intensities decrease from the interior to the exterior, and almost disappear near the surface. The O K edge line scans that are parallel to the surface (Extended Data Fig. 9d) further confirm that oxygen release uniformly |
| 28 | 7 | 1 | 1 | 500 | top_margin | column_1_of_2 | p7:body_region:0 | [39.69, 49.56, 256.65, 125.91] | occurs in the whole particle surface as the O pre-peak disappears. It is notable that oxygen release predominately occurs near surfaces, where strain evolves most drastically during initial charge, verifying that strain accumulation is the root cause of oxygen release. Concurrently, Mn L edges shift to the left near surfaces (Fig. 4j). Two-dimensional (2D) EELS mapping further shows the chemical state change of Mn in the entire particle (Fig. 4k), where the surface reconstruction layer shows a lower Mn valence than the bulk, which suggests that the Mn oxidation state decreases with migration and oxygen release near the surface. These observations demonstrate how oxygen release and TM migration occur preferentially in regions where structures experience severe lattice strain. |
| 29 | 7 | 3 | 3 | 502 | page_body | column_1_of_2 | p7:body_region:0 | [39.69, 210.81, 256.67, 158.16] | Although the fact that oxygen release or vacancies are generated extensively in the bulk, and aggravate structural/electrochemical degradation, has been recognized recently, the driving force remains unclear 43-45 . TM migration and irreversible phase transition also remain localized to surfaces in TEM observations, and unobservable in macroscopic characterizations 46-48 . Therefore, it is questionable as to whether such local structural degradation can undermine the overall electrochemical behaviour. Here, our work details dynamic nanostructure evolution and local structure interaction that were previously unobservable. With multiscale characterizations and DFT calculation, lattice displacement/strain that are induced by non-equilibrium structural dynamics are found to be the driving force for voltage fade. Consequently, nanoscale strain evolution provides a plausible explanation for the origin of oxygen release and TM migration, thus unifying previous theories for voltage fade. |
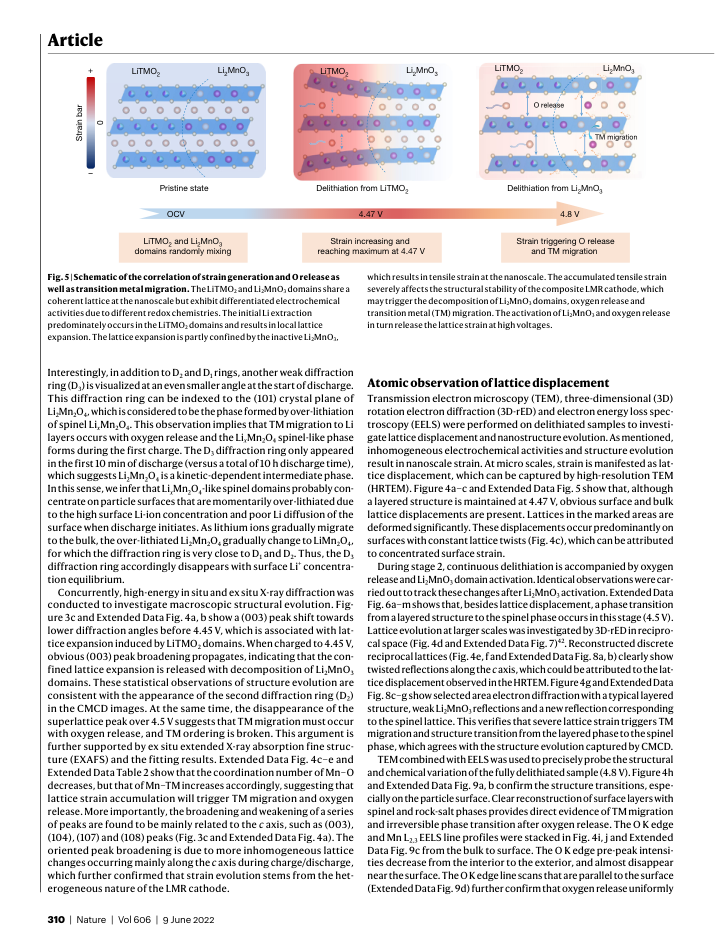
| 30 | 7 | 4 | 4 | 503 | page_body | column_1_of_2 | p7:body_region:0 | [39.69, 372.06, 256.72, 179.66] | The strain-induced structure degradation is detailed schematically in Fig. 5. Generally, different electrochemical reactivities but coherent lattice structures for two domains constitute a prerequisite for lattice strain. LiTMO 2 activation increases local electrostatic repulsion with a tendency for lattice expansion. By contrast, due to the inactive O redox of Li 2 MnO3 domains, their lattice expansion is partly confined, resulting in severe nanoscale strain with lattice displacement. Lattice strain initiates from the particle surface, gradually extends into the bulk with continuous delithiation and peaks when LiTMO 2 domains reach near-total delithiation. These extreme strains substantially destabilize structures, and trigger Li 2 MnO3 decomposition with oxygen release. When Li2 MnO3 domains are activated, the imposed lattice expansion is naturally released and tensile strain relaxes synchronously. Similarly, oxygen release also significantly lowers TM migration energy barriers, resulting in irreversible phase transition 49 . Such strain evolution would adversely accumulate on long-term cycling, and inevitably cause structural degradation and fast electrochemical decay. |
| 31 | 7 | 5 | 5 | 504 | bottom_margin | column_1_of_2 | p7:body_region:0 | [39.69, 554.81, 256.68, 190.41] | Therefore, heterogeneous composite structures with different electrochemical activities are found to cause lattice strain in the LMR cathode. This explains why post treatments, such as surface engineering methods, are ineffective for voltage decay. To resolve this issue, practical solutions for these lattice strain challenges must address heterogeneous structures in the LMR cathodes and their differential electrochemical activities, which requires fundamental consideration of composition design or local structure regulation. Altering the domain mesostructure in O3-type LMR cathodes has been challenging, so we attempted to eliminate composite domain structure with homogeneous atomic arrangement in O2-type LMR cathodes. Extended Data Fig. 10a, b shows an O2-type Li x Ni0.13 Mn0.54 Co0.13 O2 cathode that eliminates the composite domain structure with homogeneous atomic arrangement. Notably, the differential electrochemical activities are effectively suppressed, as evidenced by the smooth charging behaviour with no differentiated voltage plateau (Extended Data Fig. 10c, d). Therefore, well-integrated electrochemical activities in the O2-based cathode eliminate the prerequisite for strain generation, inhibit oxygen |
| 32 | 7 | 6 | 6 | 505 | top_margin | column_2_of_2 | p7:body_region:1 | [306.14, 49.56, 256.65, 104.41] | release and achieve enhanced electrochemical performance with stable voltages. This proves that addressing lattice strain is essential to solve voltage fade, a long-standing issue. Other realistic strategies based on electrochemical reactivity are similarly promising. It is ideal if two redox reactions can be completely blended to realize cationic/anionic hybrid redox in the cathode across wide voltage ranges. This could not only eliminate inhomogeneous reactivity across two domains, but also access higher energy density, which potentially carries forward the practical application of anionic redox or cationic/anionic hybrid cathode materials. |
| 33 | 8 | 23 | 25 | 561 | page_body | column_2_of_2 | [306.14, 247.96, 234.57, 13.28] | Publisher's note Springer Nature remains neutral with regard to jurisdictional claims in published maps and institutional affiliations. | |
| 34 | 9 | 3 | 3 | 565 | body_zone | column_1_of_2 | p9:body_region:0 | [39.69, 81.81, 256.65, 190.41] | Li 1.2 Ni 0.13 Mn0.54 Co0.13 O2 used in this paper is one of the most representative compositions for Li- and Mn-rich layered oxides and has been frequently used as a model material for understanding mechanism. Synthesis of primary particles, rather than secondary particles, was purposely controlled for minimizing interference from morphological factors. The primary particle cathode materials of Li 1.2 Ni0.13 Mn0.54 Co0.13 O2 were synthesized using a sol-gel method. In a typical synthesis, LiCH3COO·2H2O (Aladdin, 99%), Ni(CH 3 COO)2·4H2O (Aladdin, 99%), Co(CH3COO)2·4H2O (Aladdin, 99.5%), Mn(CH 3 COO)2·4H2O (Aladdin, 99%) and polyvinylpyrrolidone (Aladdin, K30) were mixed in a molar ratio of 9:1:1:4:30 and then dissolved in 100 ml deionized water. The resulting solution was dried at 90 °C overnight under continuous stirring and then calcinated at 500 °C for 3 h. The obtained powder was thoroughly ground and mixed in a mortar and then calcinated at 900 °C for 12 h to obtain the final product. Extended Data Fig. 1a-e shows a single-particle morphology with sizes ranging from 200 to 600 nm, which is an ideal size for the BCDI measurements. Data in Extended Data Fig. 1f confirm that the composition of the as-prepared sample was close to the designed composition. |
| 35 | 9 | 4 | 4 | 566 | body_zone | column_1_of_2 | p9:body_region:0 | [39.69, 275.31, 256.65, 159.13] | The O2 phase-based Li x Ni0.13 Mn0.54 Co0.13 O2 was synthesized using a sol-gel method followed by a low-temperature ion exchange method. NaCH3COO·3H2O (Aladdin, 99%), LiCH3COO·2H2O (Aladdin, 99%), Ni(CH3COO)2·4H2O (Aladdin, 99%), Mn(CH 3 COO)2·4H2O (Aladdin, 99%), Co(CH3COO)2·4H2O (Aladdin, 99%) and polyvinylpyrrolidone (Aladdin, K30) were mixed in a molar ratio of 85:20:13:54:13:370 and then dissolved in 50 ml deionized water. The resulting solution was dried at 90 °C overnight and then calcinated at 500 °C for 3 h. The obtained powder was thoroughly ground and mixed in a mortar and then calcinated at 800 °C for 10 h to obtain the sodium-containing precursor, Na0.83 Li 0.2 Ni0.13 Co0.13 Mn0.54 O2. Note that 20% Li in this precursor mainly occupies the TM layers, and 83% Na occupies the Na layers. Finally, the precursor was subjected to ion exchange in eutectic LiNO 3 -LiCl at 280 °C for 4 h to obtain Li 0.83 Li 0.2 Ni0.13 Mn0.54 Co0.13 O2. To simplify, this can be written as Li 1.03 Ni0.13 Mn0.54 Co0.13 O2. |
| 36 | 9 | 6 | 6 | 568 | body_zone | column_1_of_2 | p9:body_region:0 | [39.69, 458.06, 256.68, 158.16] | For electrode preparation, active materials were mixed with carbon black (C45 Conductive Carbon Black, TIMCAL) and polyvinylidene fluoride (PVDF, 8 wt% Solvay 5130 PVDF binder dissolved in N -methyl-2-pyrrolidone (NMP)) at 80:10:10 wt% ratios, followed by grinding the mixture in a mortar at 2,000 r.p.m. for 9 min (for 3 times 3 min) in an air atmosphere. The slurry was coated onto 10 µm thick Al foil and then punched into round pieces with a diameter of 14 mm. The electrodes were dried at 80 °C under vacuum for 12 h to remove all traces of solvent. The 2032-type coin cells were used to prepare lithium metal cells. Celgard 2325 separators (25 µm), 1.2 M LiPF 6 in ethylene carbonate/ ethyl methyl carbonate (EC/EMC) (3:7) electrolyte (GEN II with a water content below 20 ppm, 40 µl) and Li metal foil (MTI, 16 mm × 0.6 mm (diameter × thickness), high purity of 99.9%) were used. The half cells were then cycled between 2.0 and 4.8 V versus Li + /Li, using small amounts of powder (approximately 5.2 mg cm -2 ) as positive electrodes. |
| 37 | 9 | 7 | 7 | 569 | body_zone | column_1_of_2 | p9:body_region:0 | [39.69, 619.31, 256.66, 50.66] | The GITT measurements were performed by periodically pulsing and relaxing the battery between 2.0 and 4.8 V using a NEWARE electrochemical analyser with a 10 min pulse at 25 mA g -1 followed by 2 h relaxation for every step. The Li + diffusion coefficient ( D Li+ ) was calculated using equation (1): |
| 38 | 9 | 8 | 8 | 570 | bottom_margin | column_1_of_2 | p9:body_region:0 | [39.69, 716.06, 256.62, 29.16] | in which τ is the pulse time of 600 s, R s is the particle equivalent radius of 200 nm, ∆ E s is the steady-state voltage change and ∆ E t is the total voltage change during the current pulse. |
| 39 | 9 | 10 | 10 | 572 | body_zone | column_2_of_2 | p9:body_region:1 | [306.14, 71.06, 256.69, 211.91] | Bragg coherent diffraction data were collected at the 34-ID-C beamline of the Advanced Photon Source (APS). For the coherent diffraction analysis shown in this manuscript, we used 11.2 and 9 keV monochromatic beams in two independent experiments. The coherent X-ray beam was focused using a pair of Kirkpatrick-Baez (KB) mirrors to approximately 1 × 1 µm 2 illuminating the LMR nanocrystals. The measurement was done on a 10 µm thick LMR electrode in transmission geometry. We used the same in situ coin cell set-up that was implemented in the previous experiments, with a window opening of 1 mm (ref. 39 ). The coin cell was mounted vertically on a coin cell holder with the LMR electrode located downstream to minimize the absorption of the diffracted X-rays. The particle morphology of the LMR particles was examined with scanning electron microscopy (SEM), indicating 200-600 nm sized LMR particles (Extended Data Fig. 1). From the fringe spacing in the diffraction patterns, we estimated that the measured LMR nanoparticle size is approximately 600 nm. These 3D diffraction patterns of the [003] reflection were analysed using a combination of the error reduction and the hybrid input/output algorithms to reconstruct the 3D structure and the lattice displacement along the momentum transfer direction, which is the particle c axis here. |
| 40 | 9 | 11 | 11 | 573 | body_zone | column_2_of_2 | p9:body_region:1 | [306.14, 286.06, 256.69, 179.66] | CMCD patterns were acquired using a Timepix photon-counting detector mounted D = 1,950 mm away from the sample. We obtained full rocking curves around the (003) Bragg reflection and collected 2D CMCD patterns using a 2D detector at 2 θ angles of 18.6° (∆θ = ± 0.15°), respectively. Although the full sensor of the detector has 512 × 512 pixels with a pixel size of 55 m × 55 m, the coherent diffraction patterns were collected utilizing just the first quadrant sensor, which had fewer bad pixels. Automatic background subtraction was implemented within the detector 39 . We collected 22 sets of CMCD patterns and each set included 302 CMCD patterns by rocking the sample in 0.0025° steps around the Bragg peak while we were cycling the coin cell at the C/10 current rate (the C/10 rate is the current value discharge of a battery in 20 h). Between consecutive scans, we optimized the sample position on a piezo scanning stage, to maintain the Bragg condition and avoid sample misalignment. The coin cell was cycled using an eight-channel MACCOR battery cycler while the series of measurements progressed. |
| 41 | 9 | 13 | 13 | 575 | body_zone | column_2_of_2 | p9:body_region:1 | [306.14, 501.06, 256.72, 190.41] | Powder diffraction data of the cathode materials were collected using high-energy X-ray diffraction (HEXRD) located at sector 11-ID-C of the APS at Argonne National Laboratory. A high-energy X-ray with a beam size of 0.2 mm × 0.2 mm and wavelength of 0.1173 Å was used to obtain two-dimensional (2D) diffraction patterns in the transmission geometry. X-ray patterns were recorded with a PerkinElmer large-area detector placed at 1,800 mm from the samples. Rietveld refinement of the collected HEXRD patterns was carried out using the GSAS package. Ex situ HEXRD measurements were performed at the same beamline. The electrodes were dissembled from the coin cells charged or discharged to different potentials. With high penetration and low absorption, synchrotron HEXRD precisely reflects bulk sample structure properties, which is beneficial when observing tiny phase changes that are usually invisible in laboratory-scale X-ray diffraction due to poor background noise. To avoid peak interference from the Al current collector, a freestanding LMR electrode was prepared from a mixture of LMR powder, carbon black and polytetrafluoroethylene at 80:10:10 wt% ratios. |
| 42 | 9 | 14 | 14 | 576 | bottom_margin | column_2_of_2 | p9:body_region:1 | [306.14, 694.56, 256.73, 50.66] | X-ray absorption near-edge structure and EXAFS for Mn K edge were performed at the APS on the bending-magnet beamline 9-BM-B. X-ray photon energy was monochromatized by an Si (111) double-crystal monochromator. Higher order harmonic contaminations were eliminated by detuning the monochromator to reduce the incident X-ray |
| 43 | 10 | 2 | 2 | 578 | top_margin | column_1_of_2 | p10:body_region:0 | [39.69, 49.56, 256.48, 18.41] | intensity by approximately 30%. All spectra were collected at room temperature in the transmission mode. |
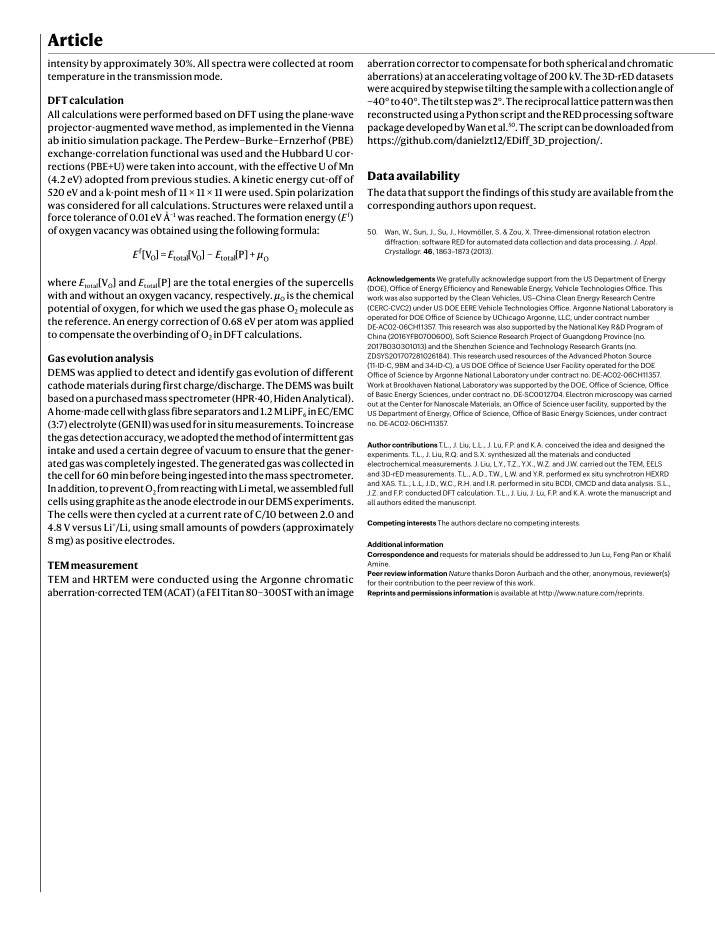
| 44 | 10 | 4 | 4 | 580 | page_body | column_1_of_2 | p10:body_region:0 | [39.69, 92.56, 256.73, 104.41] | All calculations were performed based on DFT using the plane-wave projector-augmented wave method, as implemented in the Vienna ab initio simulation package. The Perdew-Burke-Ernzerhof (PBE) exchange-correlation functional was used and the Hubbard U corrections (PBE+U) were taken into account, with the effective U of Mn (4.2 eV) adopted from previous studies. A kinetic energy cut-off of 520 eV and a k-point mesh of 11 × 11 × 11 were used. Spin polarization was considered for all calculations. Structures were relaxed until a force tolerance of 0.01 eV Å -1 was reached. The formation energy ( E f ) of oxygen vacancy was obtained using the following formula: |
| 45 | 10 | 5 | 5 | 581 | page_body | column_1_of_2 | p10:body_region:0 | [39.69, 232.31, 256.7, 51.63] | where E total [VO] and E total [P] are the total energies of the supercells with and without an oxygen vacancy, respectively. μ O is the chemical potential of oxygen, for which we used the gas phase O 2 molecule as the reference. An energy correction of 0.68 eV per atom was applied to compensate the overbinding of O 2 in DFT calculations. |
| 46 | 10 | 7 | 7 | 583 | page_body | column_1_of_2 | p10:body_region:0 | [39.69, 307.56, 256.69, 147.41] | DEMS was applied to detect and identify gas evolution of different cathode materials during first charge/discharge. The DEMS was built based on a purchased mass spectrometer (HPR-40, Hiden Analytical). A home-made cell with glass fibre separators and 1.2 M LiPF 6 in EC/EMC (3:7) electrolyte (GEN II) was used for in situ measurements. To increase the gas detection accuracy, we adopted the method of intermittent gas intake and used a certain degree of vacuum to ensure that the generated gas was completely ingested. The generated gas was collected in the cell for 60 min before being ingested into the mass spectrometer. In addition, to prevent O 2 from reacting with Li metal, we assembled full cells using graphite as the anode electrode in our DEMS experiments. The cells were then cycled at a current rate of C/10 between 2.0 and 4.8 V versus Li + /Li, using small amounts of powders (approximately 8 mg) as positive electrodes. |
| 47 | 10 | 9 | 9 | 585 | page_body | column_1_of_2 | p10:body_region:0 | [39.69, 479.56, 256.62, 18.41] | TEM and HRTEM were conducted using the Argonne chromatic aberration-corrected TEM (ACAT) (a FEI Titan 80-300ST with an image |
| 48 | 10 | 10 | 10 | 586 | top_margin | column_2_of_2 | p10:body_region:1 | [306.14, 49.56, 256.66, 72.16] | aberration corrector to compensate for both spherical and chromatic aberrations) at an accelerating voltage of 200 kV. The 3D-rED datasets were acquired by stepwise tilting the sample with a collection angle of -40° to 40°. The tilt step was 2°. The reciprocal lattice pattern was then reconstructed using a Python script and the RED processing software package developed by Wan et al. 50 . The script can be downloaded from |