这里是差集:Docling 全量解析 text block 减去最终会进入正文的 block。优先人工检查 risk=high / medium。
layout_review.html excluded_blocks.json excluded_blocks.tsv final_body_blocks.tsv visual_assets.tsv original.pdf
{
  "parsed_text_blocks": 248,
  "final_body_blocks": 22,
  "excluded_blocks": {
    "count": 226,
    "by_reason": {
      "after_back_matter_stop": 174,
      "docling_page_footer": 14,
      "outside_body_flow_caption": 8,
      "page_margin_header": 8,
      "docling_page_header": 5,
      "body_heading": 4,
      "document_web_address": 3,
      "first_page_metadata": 3,
      "document_ui": 2,
      "empty_after_cleaning": 2,
      "back_matter_heading": 1,
      "front_matter_author_line": 1,
      "non_body_heading": 1
    },
    "by_role_guess": {
      "reference": 64,
      "page_footer": 48,
      "body_candidate_excluded": 34,
      "page_margin_header": 23,
      "page_header": 18,
      "caption": 12,
      "body_heading": 9,
      "unknown_text": 5,
      "back_matter_heading": 4,
      "metadata": 4,
      "affiliation": 2,
      "back_matter_text": 2,
      "title_candidate": 1
    },
    "by_risk_level": {
      "low": 189,
      "medium": 37
    },
    "high_risk_count": 0,
    "medium_risk_count": 37
  },
  "char_counts": {
    "parsed_text_chars": 61283,
    "final_body_chars": 14458,
    "excluded_chars": 46825
  }
}
{
  "truncated": true,
  "message": "Body extraction stopped at page 5 block #/texts/56#prov1: Supporting Information) with a good agreement with the data as shown in Figure 9 a. Similarly, the EXAFS data of the cycleddischarged sample were explained by a Li 2 MnO 3 structure. 174 following text blocks were excluded as after_back_matter_stop.",
  "stop_trigger": {
    "ref": "#/texts/56#prov1",
    "page": 5,
    "layout_order": 73,
    "role_guess": "back_matter_heading",
    "body_decision_reason": "back_matter_heading",
    "text_preview": "Supporting Information) with a good agreement with the data as shown in Figure 9 a. Similarly, the EXAFS data of the cycleddischarged sample were explained by a Li 2 MnO 3 structure"
  },
  "first_truncated_block": {
    "ref": "#/texts/58",
    "page": 5,
    "layout_order": 74,
    "role_guess": "caption",
    "body_decision_reason": "after_back_matter_stop",
    "text_preview": "Figure 9. EXAFS fi ts to the data of Li 2 MnO 3 samples a) when charged to 5 V and b) when discharged to 2 V during the 33 rd cycle."
  },
  "truncated_block_count": 174,
  "truncated_pages": [
    5,
    6,
    7,
    8,
    9,
    10,
    11,
    12
  ],
  "by_role_guess": {
    "reference": 62,
    "body_candidate_excluded": 34,
    "page_footer": 32,
    "page_margin_header": 13,
    "page_header": 12,
    "body_heading": 5,
    "unknown_text": 5,
    "caption": 4,
    "back_matter_heading": 3,
    "back_matter_text": 2,
    "affiliation": 1,
    "metadata": 1
  }
}
这些框显示被排除块,同时叠加真实图表资产框。青色虚线表示该 text block 被图表资产 caption 吸收;红色 STOP 是截断触发点,红色框是截断后被排除的块。
这是实际图表资产输出,不是审计层重新推断。
| # | type | label | page | caption source | suppressed | duplicate reason | rescue reason | group | confidence | bbox | caption |
|---|---|---|---|---|---|---|---|---|---|---|---|
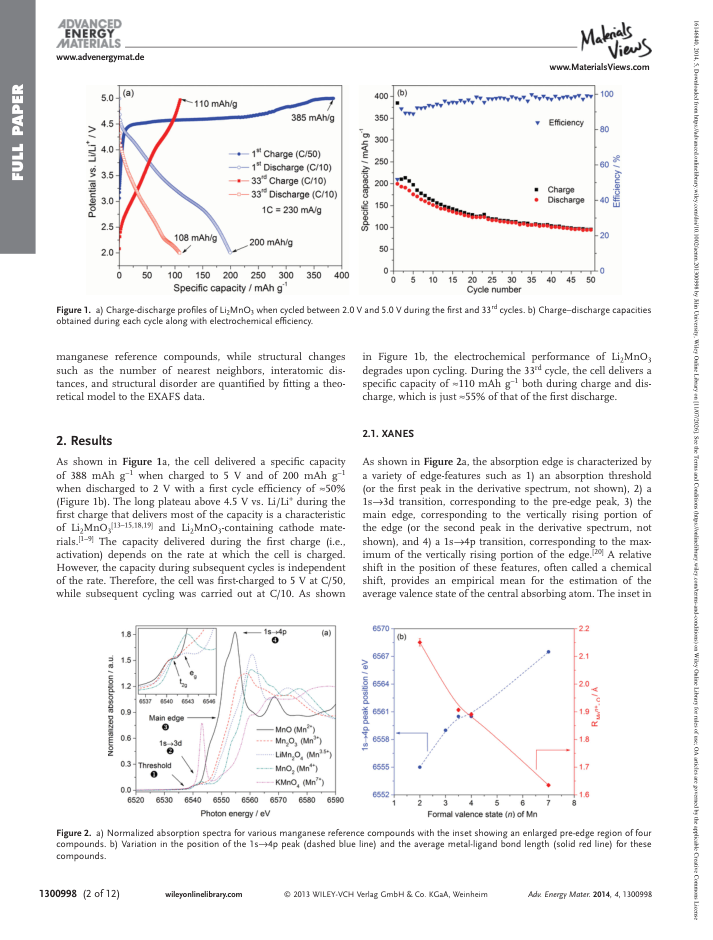
| 1 | figure | Fig. 1 | 2 | region_rescue_caption | expanded_partial_docling_crop | 0.82 | [72.3, 71.17, 445.27, 174.36] | Figure 1. a) Charge-discharge profi les of Li 2 MnO 3 when cycled between 2.0 V and 5.0 V during the fi rst and 33 rd cycles. b) Charge-discharge capacities obtained during each cycle along with electrochemical effi ciency. | |||
| 2 | figure | Fig. 1 | 2 | region_rescue_caption | expanded_partial_docling_crop | 0.82 | [72.3, 71.17, 445.27, 174.36] | Figure 1. a) Charge-discharge profi les of Li 2 MnO 3 when cycled between 2.0 V and 5.0 V during the fi rst and 33 rd cycles. b) Charge-discharge capacities obtained during each cycle along with electrochemical effi ciency. | |||
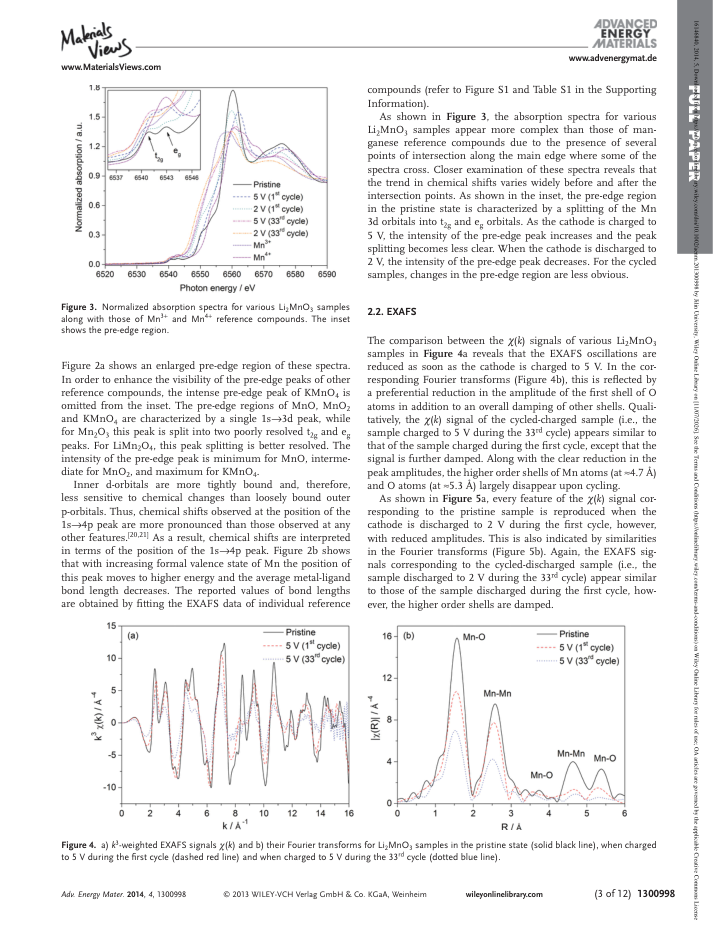
| 3 | figure | Fig. 2 | 2 | region_rescue_caption | expanded_partial_docling_crop | 0.82 | [90.0, 521.38, 409.88, 160.32] | Figure 2. a) Normalized absorption spectra for various manganese reference compounds with the inset showing an enlarged pre-edge region of four compounds. b) Variation in the position of the 1s → 4p peak (dashed blue line) and the average metal-ligand bond length (solid red line) for these compounds. | |||
| 4 | figure | Fig. 2 | 2 | region_rescue_caption | expanded_partial_docling_crop | 0.82 | [90.0, 521.38, 409.88, 160.32] | Figure 2. a) Normalized absorption spectra for various manganese reference compounds with the inset showing an enlarged pre-edge region of four compounds. b) Variation in the position of the 1s → 4p peak (dashed blue line) and the average metal-ligand bond length (solid red line) for these compounds. | |||
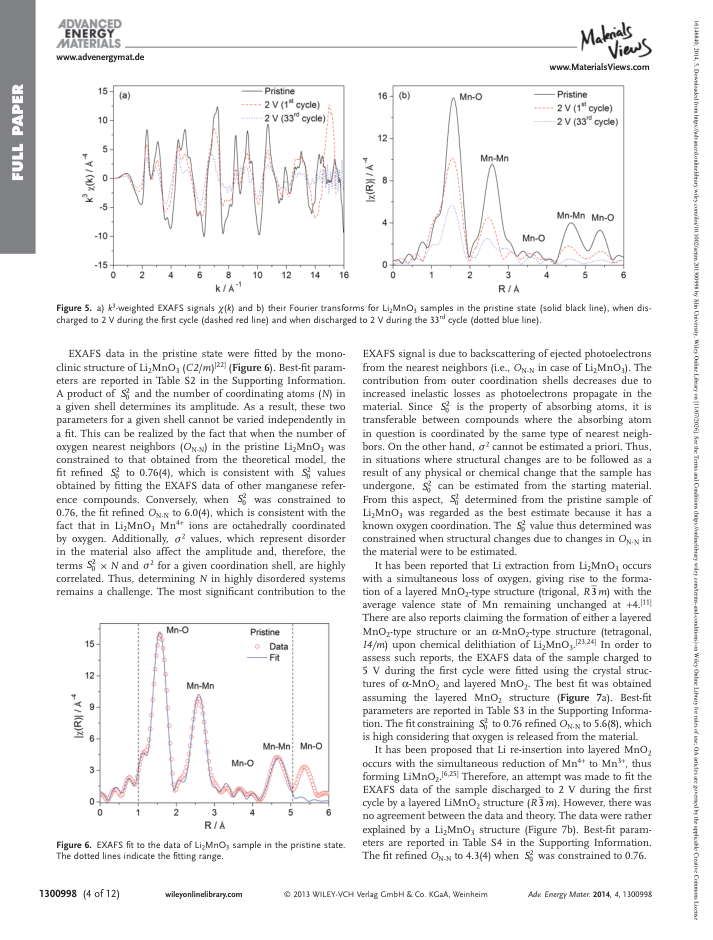
| 5 | figure | Fig. 3 | 3 | direct_caption_ref | 0.82 | [61.65, 70.31, 218.87, 174.4] | Figure 3. Normalized absorption spectra for various Li 2 MnO 3 samples along with those of Mn 3 + and Mn 4 + reference compounds. The inset shows the pre-edge region. | ||||
| 6 | figure | Fig. 4 | 3 | region_rescue_caption | expanded_partial_docling_crop | 0.82 | [76.38, 518.92, 445.39, 172.8] | Figure 4. a) k 3 -weighted EXAFS signals χ ( k ) and b) their Fourier transforms for Li 2 MnO 3 samples in the pristine state (solid black line), when charged to 5 V during the fi rst cycle (dashed red line) and when charged to 5 V during the 33 rd cycle (dotted blue line). | |||
| 7 | figure | Fig. 4 | 3 | region_rescue_caption | expanded_partial_docling_crop | 0.82 | [76.38, 518.92, 445.39, 172.8] | Figure 4. a) k 3 -weighted EXAFS signals χ ( k ) and b) their Fourier transforms for Li 2 MnO 3 samples in the pristine state (solid black line), when charged to 5 V during the fi rst cycle (dashed red line) and when charged to 5 V during the 33 rd cycle (dotted blue line). | |||
| 8 | figure | Fig. 5 | 4 | direct_caption_ref | 0.82 | [65.55, 70.58, 457.31, 174.05] | Figure 5. a) k 3 -weighted EXAFS signals χ ( k ) and b) their Fourier transforms for Li 2 MnO 3 samples in the pristine state (solid black line), when discharged to 2 V during the fi rst cycle (dashed red line) and when discharged to 2 V during the 33 rd cycle (dotted blue line). | ||||
| 9 | figure | Fig. 6 | 4 | direct_caption_ref | 0.82 | [58.3, 518.52, 218.23, 172.54] | Figure 6. EXAFS fi t to the data of Li 2 MnO 3 sample in the pristine state. The dotted lines indicate the fi tting range. | ||||
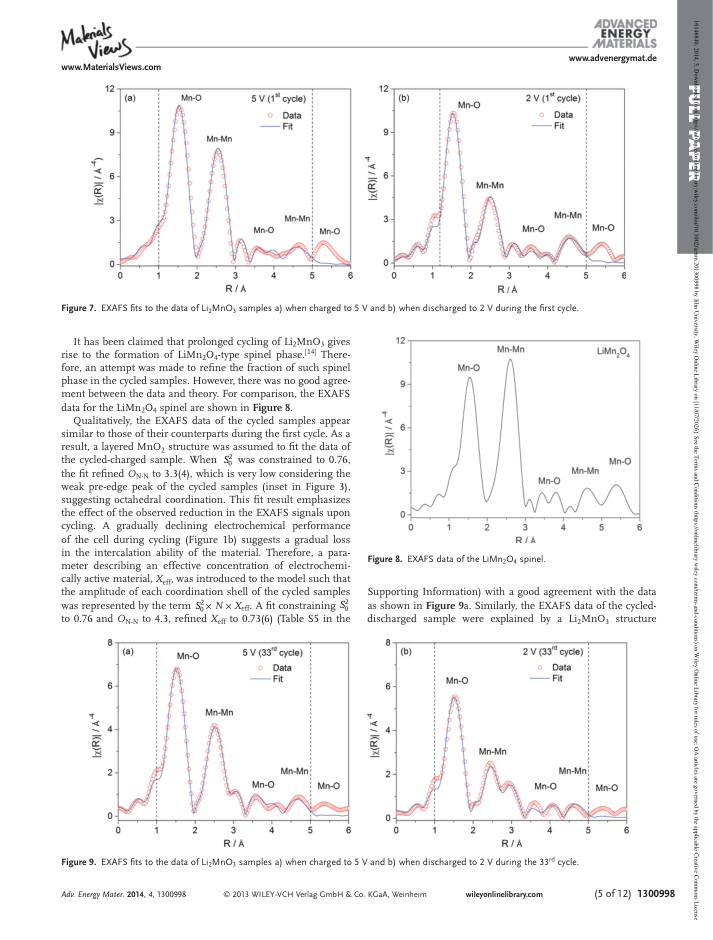
| 10 | figure | Fig. 7 | 5 | direct_caption_ref | 0.82 | [74.56, 70.32, 447.4, 175.64] | Figure 7. EXAFS fi ts to the data of Li 2 MnO 3 samples a) when charged to 5 V and b) when discharged to 2 V during the fi rst cycle. | ||||
| 11 | figure | Fig. 8 | 5 | direct_caption_ref | 0.82 | [317.7, 278.81, 218.0, 175.49] | Figure 8. EXAFS data of the LiMn 2 O 4 spinel. | ||||
| 12 | figure | Fig. 9 | 5 | nearby_text_caption | 0.82 | [72.74, 531.7, 451.84, 174.0] | Figure 9. EXAFS fi ts to the data of Li 2 MnO 3 samples a) when charged to 5 V and b) when discharged to 2 V during the 33 rd cycle. | ||||
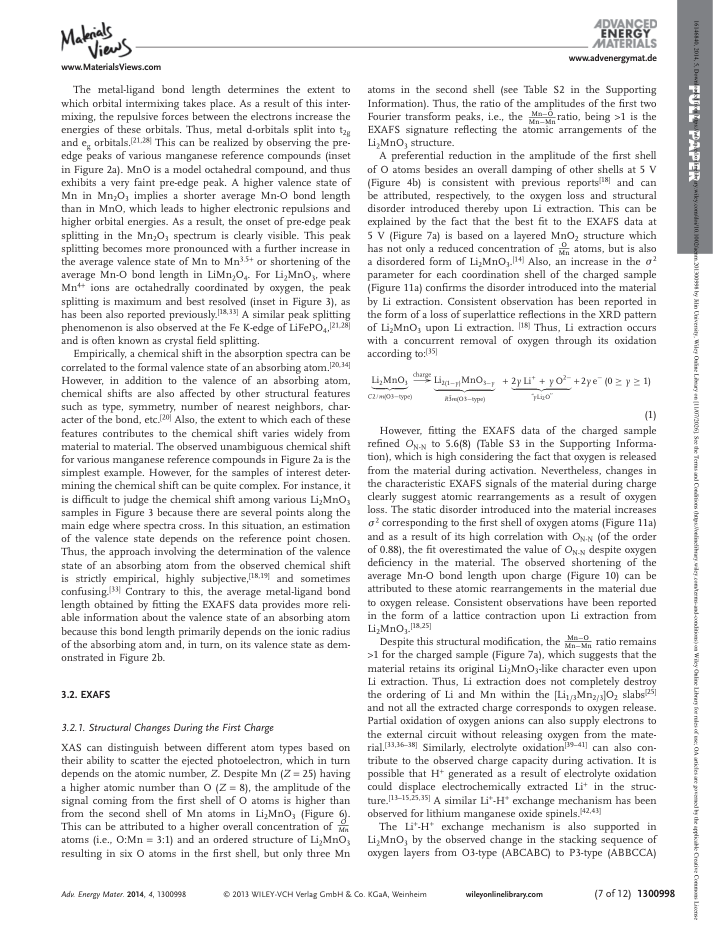
| 13 | figure | Fig. 10 | 6 | direct_caption_ref | 0.82 | [57.97, 69.93, 217.96, 175.31] | Figure 10. Comparison of the metal-ligand bond length for the electrochemically cycled Li 2 MnO 3 samples during the fi rst and 33 rd cycles. The asterisk (*) represents the charged-discharged samples during the 33 rd cycle. The solid line indicates the average Mn 4 + -O bond length obtained by fi tting the EXAFS data of the MnO 2 reference compound and dotted lines indicate statistical uncertainties of the fi tted value. | ||||
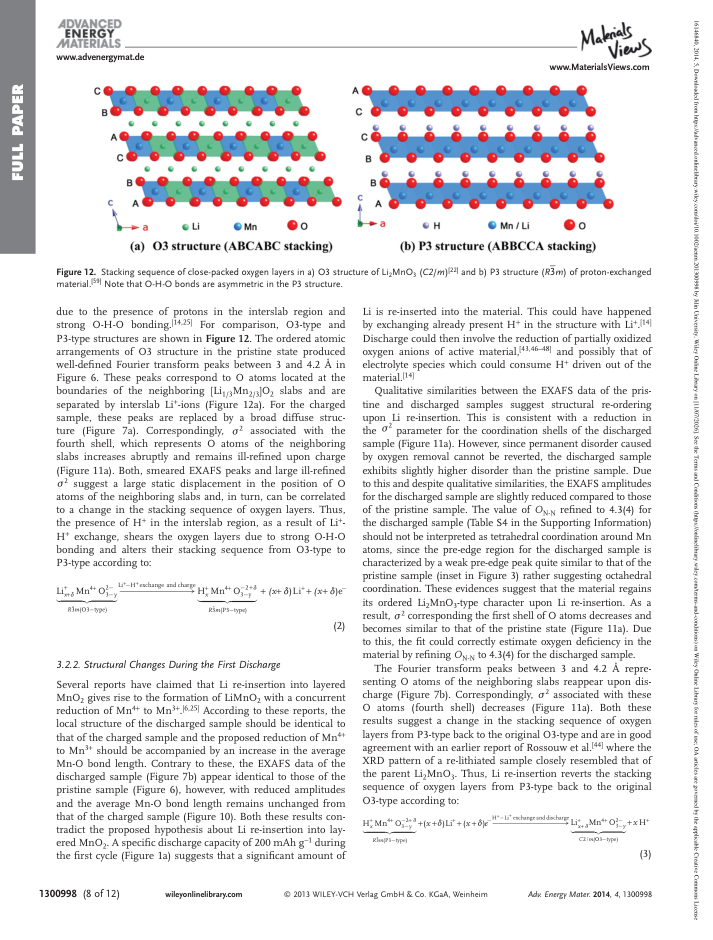
| 14 | figure | Fig. 11 | 6 | direct_caption_ref | 0.82 | [70.98, 527.24, 445.98, 174.41] | Figure 11. Structural disorder in charged-discharged samples of Li 2 MnO 3 a) during the fi rst cycle and b) during the 33 rd cycle. | ||||
| 15 | figure | Fig. 12 | 8 | direct_caption_ref | 0.82 | [78.11, 68.94, 435.14, 142.68] | Figure 12. Stacking sequence of close-packed oxygen layers in a) O3 structure of Li 2 MnO 3 ( C2 / m ) [ 22 ] and b) P3 structure ( R 3 m ) of proton-exchanged material. [ 59 ] Note that O-H-O bonds are asymmetric in the P3 structure. |
| risk | page | order | label | role | reason | parser reason | production usage | trunc | body region | region | bg | bbox | raw text | cleaned text |
|---|---|---|---|---|---|---|---|---|---|---|---|---|---|---|
| medium | 1 | 4 | text | affiliation | front_matter_author_line | front_matter_author_line | p1:body_region:0 | p1:page_body:column_1_of_2:white | [255, 255, 255] white | [51.06, 130.55, 448.73, 29.6] | Jatinkumar Rana ,* Marian Stan , Richard Kloepsch , Jie Li , Gerhard Schumacher , Edmund Welter , Ivo Zizak , John Banhart ,* and Martin Winter | Jatinkumar Rana ,* Marian Stan , Richard Kloepsch , Jie Li , Gerhard Schumacher , Edmund Welter , Ivo Zizak , John Banhart ,* and Martin Winter | ||
| medium | 1 | 8 | text | metadata | first_page_metadata | first_page_metadata | p1:body_region:0 | p1:page_body:column_1_of_2:white | [255, 255, 255] white | [51.01, 546.37, 182.72, 153.79] | Dr. J. Rana, Dr. G. Schumacher, Dr. I. Zizak, Prof. J. Banhart Helmholtz-Zentrum Berlin für Materialien und Energie Hahn-Meitner-Platz 1 , 14109 , Berlin , Germany E-mail: jatinkumar.rana@helmholtz-berlin.de ; banhart@helmholtz-berlin.de Dr. M. Stan, R. Kloepsch, Dr. J. Li, Prof. M. Winter Institute of Physical Chemistry MEET Battery Research Centre University of Muenster Corrensstrasse 46 , 48149 , Muenster , Germany Dr. E. Welter Deutsches Elektronen-Synchrotron Notkestrasse 85 , 22607 , Hamburg , Germany Prof. J. Banhart Technische Universität Berlin Hardenbergstrasse 36 , 10623 , Berlin , Germany | Dr. J. Rana, Dr. G. Schumacher, Dr. I. Zizak, Prof. J. Banhart Helmholtz-Zentrum Berlin für Materialien und Energie Hahn-Meitner-Platz 1 , 14109 , Berlin , Germany E-mail: jatinkumar.rana@helmholtz-berlin.de ; banhart@helmholtz-berlin.de Dr. M. Stan, R. Kloepsch, Dr. J. Li, Prof. M. Winter Institute of Physical Chemistry MEET Battery Research Centre University of Muenster Corrensstrasse 46 , 48149 , Muenster , Germany Dr. E. Welter Deutsches Elektronen-Synchrotron Notkestrasse 85 , 22607 , Hamburg , Germany Prof. J. Banhart Technische Universität Berlin Hardenbergstrasse 36 , 10623 , Berlin , Germany | ||
| medium | 6 | 82 | text | affiliation | after_back_matter_stop | after_back_matter_stop | after_stop | p6:body_region:0 | p6:body_zone:column_1_of_2:white | [255, 255, 255] white | [46.9, 321.28, 243.2, 22.61] | (Figure 9 b). A fi t constraining S 2 0 to 0.76 and O N-N to 4.3, refi ned X eff to 0.61(5) (Table S6 in the Supporting Information). | (Figure 9 b). A fi t constraining S 2 0 to 0.76 and O N-N to 4.3, refi ned X eff to 0.61(5) (Table S6 in the Supporting Information). | |
| medium | 6 | 83 | text | body_candidate_excluded | after_back_matter_stop | after_back_matter_stop | after_stop | p6:body_region:0 | p6:body_zone:column_1_of_2:white | [255, 255, 255] white | [46.9, 345.18, 243.2, 63.52] | A comparison between the metal-ligand bond lengths of various Li 2 MnO 3 samples is shown in Figure 10 . The average Mn-O bond length in the pristine state is slightly higher than that of Mn 4 + -O. As the cathode is charged to 5 V , this bond length shortens and becomes similar to that of Mn 4 + -O. The bond length, however, remains unchanged during subsequent cycling. | A comparison between the metal-ligand bond lengths of various Li 2 MnO 3 samples is shown in Figure 10 . The average Mn-O bond length in the pristine state is slightly higher than that of Mn 4 + -O. As the cathode is charged to 5 V , this bond length shortens and becomes similar to that of Mn 4 + -O. The bond length, however, remains unchanged during subsequent cycling. | |
| medium | 6 | 84 | text | body_candidate_excluded | after_back_matter_stop | after_back_matter_stop | after_stop | p6:body_region:0 | p6:body_zone:column_1_of_2:white | [255, 255, 255] white | [46.9, 409.39, 243.2, 98.31] | F 2 is the distribution of the backscattering atoms around their mean position measured with respect to the central absorbing atom. This distribution can be either caused by thermal vibrations (thermal disorder) or by static displacement of atoms (structural disorder). [ 26,27 ] Since all samples in the present study are characterized at the same temperature (i.e., room temperature), a systematic variation in their F 2 can be attributed to structural disorder introduced in the material as a result of electrochemical cycling, while neglecting thermal | F 2 is the distribution of the backscattering atoms around their mean position measured with respect to the central absorbing atom. This distribution can be either caused by thermal vibrations (thermal disorder) or by static displacement of atoms (structural disorder). [ 26,27 ] Since all samples in the present study are characterized at the same temperature (i.e., room temperature), a systematic variation in their F 2 can be attributed to structural disorder introduced in the material as a result of electrochemical cycling, while neglecting thermal | |
| medium | 6 | 90 | text | body_candidate_excluded | after_back_matter_stop | after_back_matter_stop | after_stop | p6:body_region:1 | p6:front_matter:column_2_of_2:white | [255, 255, 255] white | [302.01, 71.43, 243.2, 129.52] | disorder. As shown in Figure 11 a, the pristine sample exhibits the smallest, while the charged sample exhibits the largest disorder for all shells during the fi rst cycle. The structural disorder for the discharged sample is intermediate and in fact, appears to revert back to that of the pristine state. Note that F 2 associated with the fourth shell is particularly large and ill-refi ned for the charged sample, while it is small and better refi ned for the discharged sample. The structural disorder associated with the cycled samples is shown in Figure 11 b. The cycled-charged sample has larger disorder than the cycled-discharged sample for all shells. However, the trend is less clear beyond the second shell. | disorder. As shown in Figure 11 a, the pristine sample exhibits the smallest, while the charged sample exhibits the largest disorder for all shells during the fi rst cycle. The structural disorder for the discharged sample is intermediate and in fact, appears to revert back to that of the pristine state. Note that F 2 associated with the fourth shell is particularly large and ill-refi ned for the charged sample, while it is small and better refi ned for the discharged sample. The structural disorder associated with the cycled samples is shown in Figure 11 b. The cycled-charged sample has larger disorder than the cycled-discharged sample for all shells. However, the trend is less clear beyond the second shell. | |
| medium | 6 | 91 | text | body_candidate_excluded | after_back_matter_stop | after_back_matter_stop | after_stop | p6:body_region:1 | p6:front_matter:column_2_of_2:white | [255, 255, 255] white | [302.01, 203.43, 243.2, 41.52] | The statistical EXAFS fi t parameters for various Li 2 MnO 3 samples are reported in Table S7 in the Supporting Information. A good agreement between the data and theory for all samples can be seen by their R -factors, which are <0.02. | The statistical EXAFS fi t parameters for various Li 2 MnO 3 samples are reported in Table S7 in the Supporting Information. A good agreement between the data and theory for all samples can be seen by their R -factors, which are <0.02. | |
| medium | 6 | 94 | text | body_candidate_excluded | after_back_matter_stop | after_back_matter_stop | after_stop | p6:body_region:1 | p6:body_zone:column_2_of_2:white | [255, 255, 255] white | [302.01, 308.08, 243.2, 198.12] | 1s → 3d transitions are forbidden by dipole rules in centrosymmetric confi gurations such as in regular octahedral symmetry. However, with increasing distortion from ideal octahedral symmetry, the probability of a transition to d-orbitals increases. For tetrahedral symmetry, the metal-ligand orbital intermixing results in dipole-allowed 1s → 3d transitions with an intense pre-edge peak. [ 21,28 ] As shown in Figure 2 a, MnO with perfect octahedral symmetry has the lowest pre-edge peak intensity. As the distortion in octahedral symmetry increases in the order Mn 2 O 3 [ 29 ] → LiMn 2 O 4 [ 30 ] → MnO 2 , [ 31 ] the intensity of the pre-edge peak increases correspondingly. KMnO 4 with tetrahedral symmetry [ 32 ] has the highest pre-edge peak intensity. Moreover, MnO with Mn 2 + exhibits the longest Mn-O bond length, while KMnO 4 with Mn 7 + has the shortest Mn-O bond length among all manganese reference compounds. Thus, the strength of the pre-edge peak can be correlated to the local coordination symmetry around the absorbing atom and the average metal-ligand bond length. | 1s → 3d transitions are forbidden by dipole rules in centrosymmetric confi gurations such as in regular octahedral symmetry. However, with increasing distortion from ideal octahedral symmetry, the probability of a transition to d-orbitals increases. For tetrahedral symmetry, the metal-ligand orbital intermixing results in dipole-allowed 1s → 3d transitions with an intense pre-edge peak. [ 21,28 ] As shown in Figure 2 a, MnO with perfect octahedral symmetry has the lowest pre-edge peak intensity. As the distortion in octahedral symmetry increases in the order Mn 2 O 3 [ 29 ] → LiMn 2 O 4 [ 30 ] → MnO 2 , [ 31 ] the intensity of the pre-edge peak increases correspondingly. KMnO 4 with tetrahedral symmetry [ 32 ] has the highest pre-edge peak intensity. Moreover, MnO with Mn 2 + exhibits the longest Mn-O bond length, while KMnO 4 with Mn 7 + has the shortest Mn-O bond length among all manganese reference compounds. Thus, the strength of the pre-edge peak can be correlated to the local coordination symmetry around the absorbing atom and the average metal-ligand bond length. | |
| medium | 7 | 98 | text | body_candidate_excluded | after_back_matter_stop | after_back_matter_stop | after_stop | p7:body_region:0 | p7:front_matter:column_1_of_2:white | [255, 255, 255] white | [51.04, 71.38, 243.2, 217.52] | The metal-ligand bond length determines the extent to which orbital intermixing takes place. As a result of this intermixing, the repulsive forces between the electrons increase the energies of these orbitals. Thus, metal d-orbitals split into t 2g and e g orbitals. [ 21,28 ] This can be realized by observing the preedge peaks of various manganese reference compounds (inset in Figure 2 a). MnO is a model octahedral compound, and thus exhibits a very faint pre-edge peak. A higher valence state of Mn in Mn 2 O 3 implies a shorter average Mn-O bond length than in MnO, which leads to higher electronic repulsions and higher orbital energies. As a result, the onset of pre-edge peak splitting in the Mn 2 O 3 spectrum is clearly visible. This peak splitting becomes more pronounced with a further increase in the average valence state of Mn to Mn 3.5 + or shortening of the average Mn-O bond length in LiMn 2 O 4 . For Li 2 MnO 3 , where Mn 4 + ions are octahedrally coordinated by oxygen, the peak splitting is maximum and best resolved (inset in Figure 3 ), as has been also reported previously. [ 18,33 ] A similar peak splitting phenomenon is also observed at the Fe K-edge of LiFePO 4 , [ 21,28 ] and is often known as crystal fi eld splitting. | The metal-ligand bond length determines the extent to which orbital intermixing takes place. As a result of this intermixing, the repulsive forces between the electrons increase the energies of these orbitals. Thus, metal d-orbitals split into t 2g and e g orbitals. [ 21,28 ] This can be realized by observing the preedge peaks of various manganese reference compounds (inset in Figure 2 a). MnO is a model octahedral compound, and thus exhibits a very faint pre-edge peak. A higher valence state of Mn in Mn 2 O 3 implies a shorter average Mn-O bond length than in MnO, which leads to higher electronic repulsions and higher orbital energies. As a result, the onset of pre-edge peak splitting in the Mn 2 O 3 spectrum is clearly visible. This peak splitting becomes more pronounced with a further increase in the average valence state of Mn to Mn 3.5 + or shortening of the average Mn-O bond length in LiMn 2 O 4 . For Li 2 MnO 3 , where Mn 4 + ions are octahedrally coordinated by oxygen, the peak splitting is maximum and best resolved (inset in Figure 3 ), as has been also reported previously. [ 18,33 ] A similar peak splitting phenomenon is also observed at the Fe K-edge of LiFePO 4 , [ 21,28 ] and is often known as crystal fi eld splitting. | |
| medium | 7 | 99 | text | body_candidate_excluded | after_back_matter_stop | after_back_matter_stop | after_stop | p7:body_region:0 | p7:front_matter:column_1_of_2:white | [255, 255, 255] white | [51.04, 291.38, 243.2, 261.52] | Empirically, a chemical shift in the absorption spectra can be correlated to the formal valence state of an absorbing atom. [ 20,34 ] However, in addition to the valence of an absorbing atom, chemical shifts are also affected by other structural features such as type, symmetry, number of nearest neighbors, character of the bond, etc. [ 20 ] Also, the extent to which each of these features contributes to the chemical shift varies widely from material to material. The observed unambiguous chemical shift for various manganese reference compounds in Figure 2 a is the simplest example. However, for the samples of interest determining the chemical shift can be quite complex. For instance, it is diffi cult to judge the chemical shift among various Li 2 MnO 3 samples in Figure 3 because there are several points along the main edge where spectra cross. In this situation, an estimation of the valence state depends on the reference point chosen. Thus, the approach involving the determination of the valence state of an absorbing atom from the observed chemical shift is strictly empirical, highly subjective, [ 18,19 ] and sometimes confusing. [ 33 ] Contrary to this, the average metal-ligand bond length obtained by fi tting the EXAFS data provides more reliable information about the valence state of an absorbing atom because this bond length primarily depends on the ionic radius of the absorbing atom and, in turn, on its valence state as demonstrated in Figure 2 b. | Empirically, a chemical shift in the absorption spectra can be correlated to the formal valence state of an absorbing atom. [ 20,34 ] However, in addition to the valence of an absorbing atom, chemical shifts are also affected by other structural features such as type, symmetry, number of nearest neighbors, character of the bond, etc. [ 20 ] Also, the extent to which each of these features contributes to the chemical shift varies widely from material to material. The observed unambiguous chemical shift for various manganese reference compounds in Figure 2 a is the simplest example. However, for the samples of interest determining the chemical shift can be quite complex. For instance, it is diffi cult to judge the chemical shift among various Li 2 MnO 3 samples in Figure 3 because there are several points along the main edge where spectra cross. In this situation, an estimation of the valence state depends on the reference point chosen. Thus, the approach involving the determination of the valence state of an absorbing atom from the observed chemical shift is strictly empirical, highly subjective, [ 18,19 ] and sometimes confusing. [ 33 ] Contrary to this, the average metal-ligand bond length obtained by fi tting the EXAFS data provides more reliable information about the valence state of an absorbing atom because this bond length primarily depends on the ionic radius of the absorbing atom and, in turn, on its valence state as demonstrated in Figure 2 b. | |
| medium | 7 | 102 | text | body_candidate_excluded | after_back_matter_stop | after_back_matter_stop | after_stop | p7:body_region:0 | p7:body_zone:column_1_of_2:white | [255, 255, 255] white | [51.04, 619.28, 243.2, 96.52] | XAS can distinguish between different atom types based on their ability to scatter the ejected photoelectron, which in turn depends on the atomic number, Z . Despite Mn ( Z = 25) having a higher atomic number than O ( Z = 8), the amplitude of the signal coming from the fi rst shell of O atoms is higher than from the second shell of Mn atoms in Li 2 MnO 3 (Figure 6 ). This can be attributed to a higher overall concentration of O Mn atoms (i.e., O:Mn = 3:1) and an ordered structure of Li 2 MnO 3 resulting in six O atoms in the fi rst shell, but only three Mn | XAS can distinguish between different atom types based on their ability to scatter the ejected photoelectron, which in turn depends on the atomic number, Z . Despite Mn ( Z = 25) having a higher atomic number than O ( Z = 8), the amplitude of the signal coming from the fi rst shell of O atoms is higher than from the second shell of Mn atoms in Li 2 MnO 3 (Figure 6 ). This can be attributed to a higher overall concentration of O Mn atoms (i.e., O:Mn = 3:1) and an ordered structure of Li 2 MnO 3 resulting in six O atoms in the fi rst shell, but only three Mn | |
| medium | 7 | 107 | text | body_candidate_excluded | after_back_matter_stop | after_back_matter_stop | after_stop | p7:body_region:1 | p7:front_matter:column_2_of_2:white | [255, 255, 255] white | [306.15, 71.4, 243.2, 53.71] | atoms in the second shell (see Table S2 in the Supporting Information). Thus, the ratio of the amplitudes of the fi rst two Fourier transform peaks, i.e., the Mn -O Mn -Mn ratio, being >1 is the EXAFS signature refl ecting the atomic arrangements of the Li 2 MnO 3 structure. | atoms in the second shell (see Table S2 in the Supporting Information). Thus, the ratio of the amplitudes of the fi rst two Fourier transform peaks, i.e., the Mn -O Mn -Mn ratio, being >1 is the EXAFS signature refl ecting the atomic arrangements of the Li 2 MnO 3 structure. | |
| medium | 7 | 108 | text | body_candidate_excluded | after_back_matter_stop | after_back_matter_stop | after_stop | p7:body_region:1 | p7:front_matter:column_2_of_2:white | [255, 255, 255] white | [306.14, 126.4, 243.2, 173.52] | A preferential reduction in the amplitude of the fi rst shell of O atoms besides an overall damping of other shells at 5 V (Figure 4 b) is consistent with previous reports [ 18 ] and can be attributed, respectively, to the oxygen loss and structural disorder introduced thereby upon Li extraction. This can be explained by the fact that the best fi t to the EXAFS data at 5 V (Figure 7 a) is based on a layered MnO 2 structure which has not only a reduced concentration of O Mn atoms, but is also a disordered form of Li 2 MnO 3 . [ 14 ] Also, an increase in the F 2 parameter for each coordination shell of the charged sample (Figure 11 a) confi rms the disorder introduced into the material by Li extraction. Consistent observation has been reported in the form of a loss of superlattice refl ections in the XRD pattern of Li 2 MnO 3 upon Li extraction. [ 18 ] Thus, Li extraction occurs with a concurrent removal of oxygen through its oxidation according to: [ 35 ] | A preferential reduction in the amplitude of the fi rst shell of O atoms besides an overall damping of other shells at 5 V (Figure 4 b) is consistent with previous reports [ 18 ] and can be attributed, respectively, to the oxygen loss and structural disorder introduced thereby upon Li extraction. This can be explained by the fact that the best fi t to the EXAFS data at 5 V (Figure 7 a) is based on a layered MnO 2 structure which has not only a reduced concentration of O Mn atoms, but is also a disordered form of Li 2 MnO 3 . [ 14 ] Also, an increase in the F 2 parameter for each coordination shell of the charged sample (Figure 11 a) confi rms the disorder introduced into the material by Li extraction. Consistent observation has been reported in the form of a loss of superlattice refl ections in the XRD pattern of Li 2 MnO 3 upon Li extraction. [ 18 ] Thus, Li extraction occurs with a concurrent removal of oxygen through its oxidation according to: [ 35 ] | |
| medium | 7 | 109 | text | body_candidate_excluded | after_back_matter_stop | after_back_matter_stop | after_stop | p7:body_region:1 | p7:front_matter:column_2_of_2:white | [255, 255, 255] white | [306.15, 355.14, 243.2, 174.71] | However, fi tting the EXAFS data of the charged sample refi ned O N-N to 5.6(8) (Table S3 in the Supporting Information), which is high considering the fact that oxygen is released from the material during activation. Nevertheless, changes in the characteristic EXAFS signals of the material during charge clearly suggest atomic rearrangements as a result of oxygen loss. The static disorder introduced into the material increases F 2 corresponding to the fi rst shell of oxygen atoms (Figure 11 a) and as a result of its high correlation with O N-N (of the order of 0.88), the fi t overestimated the value of O N-N despite oxygen defi ciency in the material. The observed shortening of the average Mn-O bond length upon charge (Figure 10 ) can be attributed to these atomic rearrangements in the material due to oxygen release. Consistent observations have been reported in the form of a lattice contraction upon Li extraction from Li 2 MnO 3 . [ 18,25 ] | However, fi tting the EXAFS data of the charged sample refi ned O N-N to 5.6(8) (Table S3 in the Supporting Information), which is high considering the fact that oxygen is released from the material during activation. Nevertheless, changes in the characteristic EXAFS signals of the material during charge clearly suggest atomic rearrangements as a result of oxygen loss. The static disorder introduced into the material increases F 2 corresponding to the fi rst shell of oxygen atoms (Figure 11 a) and as a result of its high correlation with O N-N (of the order of 0.88), the fi t overestimated the value of O N-N despite oxygen defi ciency in the material. The observed shortening of the average Mn-O bond length upon charge (Figure 10 ) can be attributed to these atomic rearrangements in the material due to oxygen release. Consistent observations have been reported in the form of a lattice contraction upon Li extraction from Li 2 MnO 3 . [ 18,25 ] | |
| medium | 7 | 110 | text | body_candidate_excluded | after_back_matter_stop | after_back_matter_stop | after_stop | p7:body_region:1 | p7:front_matter:column_2_of_2:white | [255, 255, 255] white | [306.15, 528.44, 243.2, 154.22] | Despite this structural modifi cation, the Mn -O Mn -Mn ratio remains >1 for the charged sample (Figure 7 a), which suggests that the material retains its original Li 2 MnO 3 -like character even upon Li extraction. Thus, Li extraction does not completely destroy the ordering of Li and Mn within the [Li 1/3 Mn 2/3 ]O 2 slabs [ 25 ] and not all the extracted charge corresponds to oxygen release. Partial oxidation of oxygen anions can also supply electrons to the external circuit without releasing oxygen from the material. [ 33,36-38 ] Similarly, electrolyte oxidation [ 39-41 ] can also contribute to the observed charge capacity during activation. It is possible that H + generated as a result of electrolyte oxidation could displace electrochemically extracted Li + in the structure. [ 13-15,25,35 ] A similar Li + -H + exchange mechanism has been observed for lithium manganese oxide spinels. [ 42,43 ] | Despite this structural modifi cation, the Mn -O Mn -Mn ratio remains >1 for the charged sample (Figure 7 a), which suggests that the material retains its original Li 2 MnO 3 -like character even upon Li extraction. Thus, Li extraction does not completely destroy the ordering of Li and Mn within the [Li 1/3 Mn 2/3 ]O 2 slabs [ 25 ] and not all the extracted charge corresponds to oxygen release. Partial oxidation of oxygen anions can also supply electrons to the external circuit without releasing oxygen from the material. [ 33,36-38 ] Similarly, electrolyte oxidation [ 39-41 ] can also contribute to the observed charge capacity during activation. It is possible that H + generated as a result of electrolyte oxidation could displace electrochemically extracted Li + in the structure. [ 13-15,25,35 ] A similar Li + -H + exchange mechanism has been observed for lithium manganese oxide spinels. [ 42,43 ] | |
| medium | 7 | 111 | text | body_candidate_excluded | after_back_matter_stop | after_back_matter_stop | after_stop | p7:body_region:1 | p7:body_zone:column_2_of_2:white | [255, 255, 255] white | [306.15, 682.12, 243.2, 33.54] | The Li + -H + exchange mechanism is also supported in Li 2 MnO 3 by the observed change in the stacking sequence of oxygen layers from O3-type (ABCABC) to P3-type (ABBCCA) | The Li + -H + exchange mechanism is also supported in Li 2 MnO 3 by the observed change in the stacking sequence of oxygen layers from O3-type (ABCABC) to P3-type (ABBCCA) | |
| medium | 8 | 120 | text | body_candidate_excluded | after_back_matter_stop | after_back_matter_stop | after_stop | p8:body_region:0 | p8:front_matter:column_1_of_2:white | [255, 255, 255] white | [46.9, 256.2, 243.2, 217.52] | due to the presence of protons in the interslab region and strong O-H-O bonding. [ 14,25 ] For comparison, O3-type and P3-type structures are shown in Figure 12 . The ordered atomic arrangements of O3 structure in the pristine state produced well-defi ned Fourier transform peaks between 3 and 4.2 Å in Figure 6 . These peaks correspond to O atoms located at the boundaries of the neighboring [Li 1/3 Mn 2/3 ]O 2 slabs and are separated by interslab Li + -ions (Figure 12 a). For the charged sample, these peaks are replaced by a broad diffuse structure (Figure 7 a). Correspondingly, F 2 associated with the fourth shell, which represents O atoms of the neighboring slabs increases abruptly and remains ill-refi ned upon charge (Figure 11 a). Both, smeared EXAFS peaks and large ill-refi ned F 2 suggest a large static displacement in the position of O atoms of the neighboring slabs and, in turn, can be correlated to a change in the stacking sequence of oxygen layers. Thus, the presence of H + in the interslab region, as a result of Li + -H + exchange, shears the oxygen layers due to strong O-H-O bonding and alters their stacking sequence from O3-type to P3-type according to: | due to the presence of protons in the interslab region and strong O-H-O bonding. [ 14,25 ] For comparison, O3-type and P3-type structures are shown in Figure 12 . The ordered atomic arrangements of O3 structure in the pristine state produced well-defi ned Fourier transform peaks between 3 and 4.2 Å in Figure 6 . These peaks correspond to O atoms located at the boundaries of the neighboring [Li 1/3 Mn 2/3 ]O 2 slabs and are separated by interslab Li + -ions (Figure 12 a). For the charged sample, these peaks are replaced by a broad diffuse structure (Figure 7 a). Correspondingly, F 2 associated with the fourth shell, which represents O atoms of the neighboring slabs increases abruptly and remains ill-refi ned upon charge (Figure 11 a). Both, smeared EXAFS peaks and large ill-refi ned F 2 suggest a large static displacement in the position of O atoms of the neighboring slabs and, in turn, can be correlated to a change in the stacking sequence of oxygen layers. Thus, the presence of H + in the interslab region, as a result of Li + -H + exchange, shears the oxygen layers due to strong O-H-O bonding and alters their stacking sequence from O3-type to P3-type according to: | |
| medium | 8 | 122 | text | body_candidate_excluded | after_back_matter_stop | after_back_matter_stop | after_stop | p8:body_region:0 | p8:body_zone:column_1_of_2:white | [255, 255, 255] white | [46.9, 566.7, 243.2, 151.52] | Several reports have claimed that Li re-insertion into layered MnO 2 gives rise to the formation of LiMnO 2 with a concurrent reduction of Mn 4 + to Mn 3 + . [ 6,25 ] According to these reports, the local structure of the discharged sample should be identical to that of the charged sample and the proposed reduction of Mn 4 + to Mn 3 + should be accompanied by an increase in the average Mn-O bond length. Contrary to these, the EXAFS data of the discharged sample (Figure 7 b) appear identical to those of the pristine sample (Figure 6 ), however, with reduced amplitudes and the average Mn-O bond length remains unchanged from that of the charged sample (Figure 10 ). Both these results contradict the proposed hypothesis about Li re-insertion into layered MnO 2 . A specifi c discharge capacity of 200 mAh g -1 during the fi rst cycle (Figure 1 a) suggests that a signifi cant amount of | Several reports have claimed that Li re-insertion into layered MnO 2 gives rise to the formation of LiMnO 2 with a concurrent reduction of Mn 4 + to Mn 3 + . [ 6,25 ] According to these reports, the local structure of the discharged sample should be identical to that of the charged sample and the proposed reduction of Mn 4 + to Mn 3 + should be accompanied by an increase in the average Mn-O bond length. Contrary to these, the EXAFS data of the discharged sample (Figure 7 b) appear identical to those of the pristine sample (Figure 6 ), however, with reduced amplitudes and the average Mn-O bond length remains unchanged from that of the charged sample (Figure 10 ). Both these results contradict the proposed hypothesis about Li re-insertion into layered MnO 2 . A specifi c discharge capacity of 200 mAh g -1 during the fi rst cycle (Figure 1 a) suggests that a signifi cant amount of | |
| medium | 8 | 125 | text | body_candidate_excluded | after_back_matter_stop | after_back_matter_stop | after_stop | p8:body_region:1 | p8:front_matter:column_2_of_2:white | [255, 255, 255] white | [302.01, 256.24, 243.2, 63.52] | Li is re-inserted into the material. This could have happened by exchanging already present H + in the structure with Li + . [ 14 ] Discharge could then involve the reduction of partially oxidized oxygen anions of active material, [ 43,46-48 ] and possibly that of electrolyte species which could consume H + driven out of the material. [ 14 ] | Li is re-inserted into the material. This could have happened by exchanging already present H + in the structure with Li + . [ 14 ] Discharge could then involve the reduction of partially oxidized oxygen anions of active material, [ 43,46-48 ] and possibly that of electrolyte species which could consume H + driven out of the material. [ 14 ] | |
| medium | 8 | 126 | text | body_candidate_excluded | after_back_matter_stop | after_back_matter_stop | after_stop | p8:body_region:1 | p8:front_matter:column_2_of_2:white | [255, 255, 255] white | [302.01, 322.24, 243.2, 229.71] | Qualitative similarities between the EXAFS data of the pristine and discharged samples suggest structural re-ordering upon Li re-insertion. This is consistent with a reduction in the F 2 parameter for the coordination shells of the discharged sample (Figure 11 a). However, since permanent disorder caused by oxygen removal cannot be reverted, the discharged sample exhibits slightly higher disorder than the pristine sample. Due to this and despite qualitative similarities, the EXAFS amplitudes for the discharged sample are slightly reduced compared to those of the pristine sample. The value of O N-N refi ned to 4.3(4) for the discharged sample (Table S4 in the Supporting Information) should not be interpreted as tetrahedral coordination around Mn atoms, since the pre-edge region for the discharged sample is characterized by a weak pre-edge peak quite similar to that of the pristine sample (inset in Figure 3 ) rather suggesting octahedral coordination. These evidences suggest that the material regains its ordered Li 2 MnO 3 -type character upon Li re-insertion. As a result, F 2 corresponding the fi rst shell of O atoms decreases and becomes similar to that of the pristine state (Figure 11 a). Due to this, the fi t could correctly estimate oxygen defi ciency in the material by refi ning O N-N to 4.3(4) for the discharged sample. | Qualitative similarities between the EXAFS data of the pristine and discharged samples suggest structural re-ordering upon Li re-insertion. This is consistent with a reduction in the F 2 parameter for the coordination shells of the discharged sample (Figure 11 a). However, since permanent disorder caused by oxygen removal cannot be reverted, the discharged sample exhibits slightly higher disorder than the pristine sample. Due to this and despite qualitative similarities, the EXAFS amplitudes for the discharged sample are slightly reduced compared to those of the pristine sample. The value of O N-N refi ned to 4.3(4) for the discharged sample (Table S4 in the Supporting Information) should not be interpreted as tetrahedral coordination around Mn atoms, since the pre-edge region for the discharged sample is characterized by a weak pre-edge peak quite similar to that of the pristine sample (inset in Figure 3 ) rather suggesting octahedral coordination. These evidences suggest that the material regains its ordered Li 2 MnO 3 -type character upon Li re-insertion. As a result, F 2 corresponding the fi rst shell of O atoms decreases and becomes similar to that of the pristine state (Figure 11 a). Due to this, the fi t could correctly estimate oxygen defi ciency in the material by refi ning O N-N to 4.3(4) for the discharged sample. | |
| medium | 8 | 127 | text | body_candidate_excluded | after_back_matter_stop | after_back_matter_stop | after_stop | p8:body_region:1 | p8:body_zone:column_2_of_2:white | [255, 255, 255] white | [302.01, 553.24, 243.2, 118.52] | The Fourier transform peaks between 3 and 4.2 Å representing O atoms of the neighboring slabs reappear upon discharge (Figure 7 b). Correspondingly, F 2 associated with these O atoms (fourth shell) decreases (Figure 11 a). Both these results suggest a change in the stacking sequence of oxygen layers from P3-type back to the original O3-type and are in good agreement with an earlier report of Rossouw et al. [ 44 ] where the XRD pattern of a re-lithiated sample closely resembled that of the parent Li 2 MnO 3 . Thus, Li re-insertion reverts the stacking sequence of oxygen layers from P3-type back to the original O3-type according to: | The Fourier transform peaks between 3 and 4.2 Å representing O atoms of the neighboring slabs reappear upon discharge (Figure 7 b). Correspondingly, F 2 associated with these O atoms (fourth shell) decreases (Figure 11 a). Both these results suggest a change in the stacking sequence of oxygen layers from P3-type back to the original O3-type and are in good agreement with an earlier report of Rossouw et al. [ 44 ] where the XRD pattern of a re-lithiated sample closely resembled that of the parent Li 2 MnO 3 . Thus, Li re-insertion reverts the stacking sequence of oxygen layers from P3-type back to the original O3-type according to: | |
| medium | 8 | 128 | formula | body_candidate_excluded | after_back_matter_stop | after_back_matter_stop | after_stop | p8:body_region:1 | p8:body_zone:column_2_of_2:white | [255, 255, 255] white | [302.04, 677.01, 239.02, 29.06] | H + x Mn 4 + O - 2 + * 3 - y ︸ ︷︷ ︸ R ¯ 3 m (P3 - type) + ( x + * )Li + + ( x + * ) e - - Li + + exchange and discharge Li + x + * Mn 4 + O 2 - 3 - y ︸ ︷︷ ︸ C 2 / m (O3 - type) + x H + H | H + x Mn 4 + O - 2 + * 3 - y ︸ ︷︷ ︸ R ¯ 3 m (P3 - type) + ( x + * )Li + + ( x + * ) e - - Li + + exchange and discharge Li + x + * Mn 4 + O 2 - 3 - y ︸ ︷︷ ︸ C 2 / m (O3 - type) + x H + H | |
| medium | 9 | 133 | text | body_candidate_excluded | after_back_matter_stop | after_back_matter_stop | after_stop | p9:body_region:0 | p9:front_matter:column_1_of_2:white | [255, 255, 255] white | [51.04, 71.38, 243.2, 52.52] | The resultant structure upon discharge is similar to that of the parent Li 2 MnO 3 , except that it contains less Li and O. The driving force for such structural reversion is believed to be the relaxation of strained oxygen layers by displacing H + in the interslab region by Li + . | The resultant structure upon discharge is similar to that of the parent Li 2 MnO 3 , except that it contains less Li and O. The driving force for such structural reversion is believed to be the relaxation of strained oxygen layers by displacing H + in the interslab region by Li + . | |
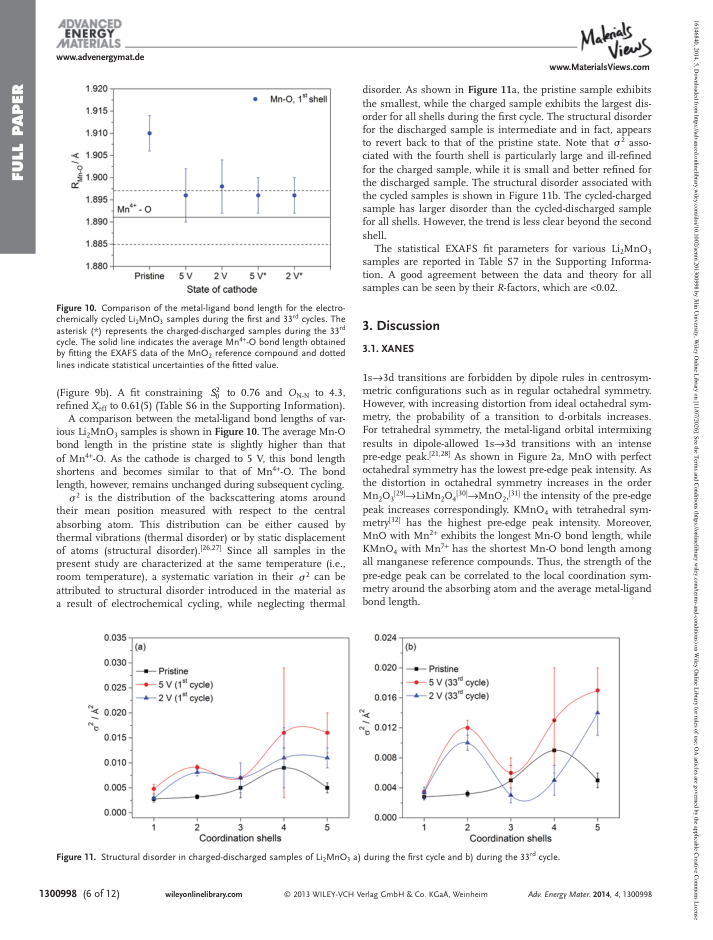
| medium | 9 | 136 | text | body_candidate_excluded | after_back_matter_stop | after_back_matter_stop | after_stop | p9:body_region:0 | p9:body_zone:column_1_of_2:white | [255, 255, 255] white | [51.04, 378.18, 243.2, 339.71] | The crystallographic difference between the layered Li 2 MnO 3 and spinel LiMn 2 O 4 gives rise to distinct EXAFS signals (Figure 6 and Figure 8 ). A major difference lies in their Mn -O Mn -Mn ratios. Based on this criterion, the local structure of the cycled samples (Figure 9 ) is more similar to their counterparts during the fi rst cycle (Figure 7 ) than to LiMn 2 O 4 . While the formation of the domains of LiMn 2 O 4 -type spinel phase upon cycling as observed during TEM investigation [ 47 ] cannot be ruled out, the presented EXAFS data of the cycled samples suggest otherwise. This discrepancy between the TEM and XAS investigations should be judged in the context of the investigated sample volume by both these techniques. Previously, Shao-Horn et al. [ 48 ] reported that an extremely small sampling size in the TEM investigation may lead to systematically biased conclusions. In case of the formation of a spinel-like phase even on the particle surface, [ 47 ] a corresponding change in the EXAFS data of the material is expected since XAS in the transmission mode provides information from both surface and bulk of all particles within the illuminated sample volume of at least a few cubic millimeters. Contrary to this, the observed reduction in the EXAFS data of the cycled samples (Figure 4 b and Figure 5 b), while maintaining the similar characteristic features as observed for the samples during the fi rst cycle suggests structural degradation of the material during cycling. This effect is analogous to the broadening of diffraction peaks in the XRD pattern of a material that loses crystallinity. In our opinion, random atomic arrangements caused by deteriorating structural changes that occur in the material during cycling may appear on an extremely local fi eld of view of TEM as randomly oriented 'spinel-like' domains. The best fi t to the EXAFS data of the cycled-charged sample is by a layered MnO 2 structure | The crystallographic difference between the layered Li 2 MnO 3 and spinel LiMn 2 O 4 gives rise to distinct EXAFS signals (Figure 6 and Figure 8 ). A major difference lies in their Mn -O Mn -Mn ratios. Based on this criterion, the local structure of the cycled samples (Figure 9 ) is more similar to their counterparts during the fi rst cycle (Figure 7 ) than to LiMn 2 O 4 . While the formation of the domains of LiMn 2 O 4 -type spinel phase upon cycling as observed during TEM investigation [ 47 ] cannot be ruled out, the presented EXAFS data of the cycled samples suggest otherwise. This discrepancy between the TEM and XAS investigations should be judged in the context of the investigated sample volume by both these techniques. Previously, Shao-Horn et al. [ 48 ] reported that an extremely small sampling size in the TEM investigation may lead to systematically biased conclusions. In case of the formation of a spinel-like phase even on the particle surface, [ 47 ] a corresponding change in the EXAFS data of the material is expected since XAS in the transmission mode provides information from both surface and bulk of all particles within the illuminated sample volume of at least a few cubic millimeters. Contrary to this, the observed reduction in the EXAFS data of the cycled samples (Figure 4 b and Figure 5 b), while maintaining the similar characteristic features as observed for the samples during the fi rst cycle suggests structural degradation of the material during cycling. This effect is analogous to the broadening of diffraction peaks in the XRD pattern of a material that loses crystallinity. In our opinion, random atomic arrangements caused by deteriorating structural changes that occur in the material during cycling may appear on an extremely local fi eld of view of TEM as randomly oriented 'spinel-like' domains. The best fi t to the EXAFS data of the cycled-charged sample is by a layered MnO 2 structure | |
| medium | 9 | 141 | text | body_candidate_excluded | after_back_matter_stop | after_back_matter_stop | after_stop | p9:body_region:1 | p9:front_matter:column_2_of_2:white | [255, 255, 255] white | [306.15, 71.4, 243.2, 162.52] | and to those of the cycled-discharged sample is by a Li 2 MnO 3 structure. These fi t results suggest that the fraction of electrochemically active material is reduced to ≈ 60-70% up to the 33 rd cycle, which is consistent with the reported structural degradation of the material [ 47 ] and, in turn, explains the observed decline in its electrochemical performance during cycling. It is reasonable to constrain the value of O N-N for the cycled samples to that obtained during the fi rst cycle for the obvious reason that oxygen is not released during each subsequent cycle, since under this situation the material would be completely depleted of oxygen anions after a few cycles. However, the weak pre-edge peak corresponding to the charged and discharged samples during the 33 rd cycle (inset in Figure 3 ) clearly suggests that local coordination symmetry around central Mn atoms is maintained as octahedral. | and to those of the cycled-discharged sample is by a Li 2 MnO 3 structure. These fi t results suggest that the fraction of electrochemically active material is reduced to ≈ 60-70% up to the 33 rd cycle, which is consistent with the reported structural degradation of the material [ 47 ] and, in turn, explains the observed decline in its electrochemical performance during cycling. It is reasonable to constrain the value of O N-N for the cycled samples to that obtained during the fi rst cycle for the obvious reason that oxygen is not released during each subsequent cycle, since under this situation the material would be completely depleted of oxygen anions after a few cycles. However, the weak pre-edge peak corresponding to the charged and discharged samples during the 33 rd cycle (inset in Figure 3 ) clearly suggests that local coordination symmetry around central Mn atoms is maintained as octahedral. | |
| medium | 9 | 142 | text | body_candidate_excluded | after_back_matter_stop | after_back_matter_stop | after_stop | p9:body_region:1 | p9:body_zone:column_2_of_2:white | [255, 255, 255] white | [306.15, 236.4, 243.2, 206.52] | These results lead us to two major conclusions. First, the structural changes during the 33 rd cycle are similar to those observed during the fi rst, however, the fraction of electrochemically active material is gradually reduced up to the 33 rd cycle. Second, oxygen removal occurs only during activation of the material in the fi rst cycle. As observed during the fi rst cycle, structural disorder for the cycled-charged sample is higher than for the cycled-discharged sample (Figure 11 b). However, the trend is less clear beyond the second shell. It should be noted that structural 'visibility' for the cycled samples is also limited to the fi rst two shells as indicated by well-defi ned Fourier transform peaks. Higher order shells of Mn atoms (at ≈ 4.7 Å) and O atoms (at ≈ 5.4 Å) clearly visible during the fi rst cycle are reduced during the 33 rd cycle (Figure 4 b and Figure 5 b). These shells represent Mn and O atoms from the neighboring [Li 1/3 Mn 2/3 ]O 2 slabs. These results suggest that atomic arrangements within an individual [Li 1/3 Mn 2/3 ]O 2 slab are intact. However, the stacking sequence of subsequent slabs is disturbed upon cycling. | These results lead us to two major conclusions. First, the structural changes during the 33 rd cycle are similar to those observed during the fi rst, however, the fraction of electrochemically active material is gradually reduced up to the 33 rd cycle. Second, oxygen removal occurs only during activation of the material in the fi rst cycle. As observed during the fi rst cycle, structural disorder for the cycled-charged sample is higher than for the cycled-discharged sample (Figure 11 b). However, the trend is less clear beyond the second shell. It should be noted that structural 'visibility' for the cycled samples is also limited to the fi rst two shells as indicated by well-defi ned Fourier transform peaks. Higher order shells of Mn atoms (at ≈ 4.7 Å) and O atoms (at ≈ 5.4 Å) clearly visible during the fi rst cycle are reduced during the 33 rd cycle (Figure 4 b and Figure 5 b). These shells represent Mn and O atoms from the neighboring [Li 1/3 Mn 2/3 ]O 2 slabs. These results suggest that atomic arrangements within an individual [Li 1/3 Mn 2/3 ]O 2 slab are intact. However, the stacking sequence of subsequent slabs is disturbed upon cycling. | |
| medium | 9 | 143 | text | body_candidate_excluded | after_back_matter_stop | after_back_matter_stop | after_stop | p9:body_region:1 | p9:body_zone:column_2_of_2:white | [255, 255, 255] white | [306.15, 445.4, 243.2, 151.52] | The average Mn-O bond length for the cycled samples (Figure 10 ) remains unchanged from that of Mn 4 + -O, which rules out the conventional charge compensation mechanism involving the Mn 3 + /Mn 4 + redox reaction. Therefore, the observed charge-discharge capacities during subsequent cycles must have different origins. Possibly, oxygen anions of active material participate in unusual redox processes [ 33,36-38 ] and repetitive, irreversible oxidation of electrolyte species occurs because both of these processes can supply electrons to the external circuit and contribute to the observed charge capacity. Protons generated as a result of electrolyte oxidation could displace electrochemically extracted Li in the interslab region and alter the stacking sequence of oxygen layers from O3-type to P3-type according to: | The average Mn-O bond length for the cycled samples (Figure 10 ) remains unchanged from that of Mn 4 + -O, which rules out the conventional charge compensation mechanism involving the Mn 3 + /Mn 4 + redox reaction. Therefore, the observed charge-discharge capacities during subsequent cycles must have different origins. Possibly, oxygen anions of active material participate in unusual redox processes [ 33,36-38 ] and repetitive, irreversible oxidation of electrolyte species occurs because both of these processes can supply electrons to the external circuit and contribute to the observed charge capacity. Protons generated as a result of electrolyte oxidation could displace electrochemically extracted Li in the interslab region and alter the stacking sequence of oxygen layers from O3-type to P3-type according to: | |
| medium | 9 | 144 | formula | body_candidate_excluded | after_back_matter_stop | after_back_matter_stop | after_stop | p9:body_region:1 | p9:body_zone:column_2_of_2:white | [255, 255, 255] white | [306.18, 607.15, 241.73, 30.59] | Li + x + * Mn 4 + O 2 - 3 - y ︸ ︷︷ ︸ C 2 / m (O3 - type) Li + - H + exchange and charge H + - Li + exchange and discharge H + x Mn 4 + O - 2 + * 3 - y ︸ ︷︷ ︸ R ¯ 3 m (P3 - type) + ( x + * )Li + + ( x + * )e - . | Li + x + * Mn 4 + O 2 - 3 - y ︸ ︷︷ ︸ C 2 / m (O3 - type) Li + - H + exchange and charge H + - Li + exchange and discharge H + x Mn 4 + O - 2 + * 3 - y ︸ ︷︷ ︸ R ¯ 3 m (P3 - type) + ( x + * )Li + + ( x + * )e - . | |
| medium | 9 | 146 | text | body_candidate_excluded | after_back_matter_stop | after_back_matter_stop | after_stop | p9:body_region:1 | p9:body_zone:column_2_of_2:white | [255, 255, 255] white | [306.15, 654.81, 243.21, 63.52] | Subsequent discharge could involve the reduction of partially oxidized oxygen anions along with electrolyte species and Li reinsertion could occur by displacing already present protons in the material with a concurrent change in the oxygen stacking sequence from P3-type back to the original O3-type (Equation 4 ). Such repetitive shearing of oxygen layers during each | Subsequent discharge could involve the reduction of partially oxidized oxygen anions along with electrolyte species and Li reinsertion could occur by displacing already present protons in the material with a concurrent change in the oxygen stacking sequence from P3-type back to the original O3-type (Equation 4 ). Such repetitive shearing of oxygen layers during each | |
| medium | 10 | 152 | text | body_candidate_excluded | after_back_matter_stop | after_back_matter_stop | after_stop | p10:body_region:0 | p10:page_body:column_1_of_2:white | [255, 255, 255] white | [46.9, 71.38, 243.2, 206.52] | subsequent cycle could lead to the loss of crystallinity of the material and consequently to the loss of its intercalation ability during cycling. The observed cleavage in Li 2 MnO 3 particles along the (001) plane [ 35 ] can be explained in terms of shearing of individual [Li 1/3 Mn 2/3 ]O 2 slab due to changing stacking sequence of oxygen layers. Moreover, the cycling curve of Li 2 MnO 3 in Figure 1 b does not show any plateau where fading levels off and at which the electrochemical performance of Li 2 MnO 3 corresponds to that of LiMn 2 O 4 spinel. In fact, fading starts right from the fi rst cycle and continues even beyond the 33 rd cycle. This suggests a continuous loss in the intercalation ability of the material as a result of continuous structural degradation during cycling. Since the suggested Li + -H + exchange mechanism could involve the repetitive consumption of electrolyte species, it would inevitably deteriorate the cell performance on the long term. However, the presented results clearly suggest that the capacity degradation is more likely to be caused by the structural degradation of active material rather than the drying-out of electrolyte. | subsequent cycle could lead to the loss of crystallinity of the material and consequently to the loss of its intercalation ability during cycling. The observed cleavage in Li 2 MnO 3 particles along the (001) plane [ 35 ] can be explained in terms of shearing of individual [Li 1/3 Mn 2/3 ]O 2 slab due to changing stacking sequence of oxygen layers. Moreover, the cycling curve of Li 2 MnO 3 in Figure 1 b does not show any plateau where fading levels off and at which the electrochemical performance of Li 2 MnO 3 corresponds to that of LiMn 2 O 4 spinel. In fact, fading starts right from the fi rst cycle and continues even beyond the 33 rd cycle. This suggests a continuous loss in the intercalation ability of the material as a result of continuous structural degradation during cycling. Since the suggested Li + -H + exchange mechanism could involve the repetitive consumption of electrolyte species, it would inevitably deteriorate the cell performance on the long term. However, the presented results clearly suggest that the capacity degradation is more likely to be caused by the structural degradation of active material rather than the drying-out of electrolyte. | |
| medium | 10 | 154 | text | body_candidate_excluded | after_back_matter_stop | after_back_matter_stop | after_stop | p10:body_region:0 | p10:page_body:column_1_of_2:white | [255, 255, 255] white | [46.9, 323.38, 243.2, 272.52] | Both XANES and EXAFS provide complementary information that helps to understand structural changes in Li 2 MnO 3 . The total charge capacity during activation can be attributed to the oxidation of oxygen anions and that of the electrolyte. The concurrent removal of oxygen along with Li gives rise to the formation of a layered MnO 2 -type structure, while maintaining a certain degree of Li and Mn ordering within its [Li 1/3 Mn 2/3 ] O 2 slabs. Protons generated as a result of electrolyte oxidation displace electrochemically extracted Li + in the structure. The presence of protons in the interslab region shears the oxygen layers due to strong O-H-O bonding and alters their stacking sequence from O3-type (ABCABC) to P3-type (ABBCCA). Li re-insertion into layered MnO 2 -type structure occurs by exchanging already present protons in the interslab region. The relaxation of strained oxygen layers caused by exchanging H + with Li + reverts their stacking sequence from P3-type back to the original O3-type. The resultant structure upon discharge closely resembles the parent Li 2 MnO 3 , however, it contains less Li and O. Mn 4 + does not participate in electrochemical processes and its average valence state remains unchanged at + 4 at all times. Irreversible oxygen release occurs only during activation of the material in the fi rst cycle. During subsequent cycles, electrochemical processes could possibly involve unusual redox processes of oxygen anions of active material together with the repetitive, irreversible oxidation of electrolyte species: | Both XANES and EXAFS provide complementary information that helps to understand structural changes in Li 2 MnO 3 . The total charge capacity during activation can be attributed to the oxidation of oxygen anions and that of the electrolyte. The concurrent removal of oxygen along with Li gives rise to the formation of a layered MnO 2 -type structure, while maintaining a certain degree of Li and Mn ordering within its [Li 1/3 Mn 2/3 ] O 2 slabs. Protons generated as a result of electrolyte oxidation displace electrochemically extracted Li + in the structure. The presence of protons in the interslab region shears the oxygen layers due to strong O-H-O bonding and alters their stacking sequence from O3-type (ABCABC) to P3-type (ABBCCA). Li re-insertion into layered MnO 2 -type structure occurs by exchanging already present protons in the interslab region. The relaxation of strained oxygen layers caused by exchanging H + with Li + reverts their stacking sequence from P3-type back to the original O3-type. The resultant structure upon discharge closely resembles the parent Li 2 MnO 3 , however, it contains less Li and O. Mn 4 + does not participate in electrochemical processes and its average valence state remains unchanged at + 4 at all times. Irreversible oxygen release occurs only during activation of the material in the fi rst cycle. During subsequent cycles, electrochemical processes could possibly involve unusual redox processes of oxygen anions of active material together with the repetitive, irreversible oxidation of electrolyte species: | |
| medium | 10 | 155 | text | body_candidate_excluded | after_back_matter_stop | after_back_matter_stop | after_stop | p10:body_region:0 | p10:page_body:column_1_of_2:white | [255, 255, 255] white | [46.9, 647.88, 243.2, 66.54] | The proposed Li + -H + exchange during each subsequent charge and discharge could involve a structural fl ip-over between O3-type ( C2 / m ) and P3-type ( R 3 m ) by repeated shearing of oxygen layers. This could deteriorate crystallinity of the material and consequently its electrochemical performance during cycling. | The proposed Li + -H + exchange during each subsequent charge and discharge could involve a structural fl ip-over between O3-type ( C2 / m ) and P3-type ( R 3 m ) by repeated shearing of oxygen layers. This could deteriorate crystallinity of the material and consequently its electrochemical performance during cycling. | |
| medium | 10 | 161 | text | body_candidate_excluded | after_back_matter_stop | after_back_matter_stop | after_stop | p10:body_region:1 | p10:page_body:column_2_of_2:white | [255, 255, 255] white | [302.01, 89.94, 242.99, 130.29] | Li 2 MnO 3 was synthesized by a modifi ed Pechini method from acetate precursors. [ 49 ] The precursor powders, Mn(OCOCH 3 ) 2 ·4H 2 O and Li(OCOCH 3 )·H 2 O were dissolved in an aqueous mixture of ethylene glycol and citric acid (molar ratio 4:1). The mole ratio of ethylene glycol and Mn 2 + was 10:1. Dissolution of reagents was completed by heating to 90 °C with constant stirring followed by a temperature increase to 140 ° C to promote esterifi cation. Subsequently, the temperature was increased to 180 ° C and maintained for 12 h, during which period the polyester formed. Then, the temperature was increased to 250 °C and held for 6 h during which the ethylene glycol dried out and the material caramelized. Calcination at 450 °C for 5 h decomposed the precursors and formed Li 2 MnO 3 . The calcined Li 2 MnO 3 powder was pressed into pellets and annealed at 600 °C for 12 h. The annealed material was characterized for phase purity by X-ray diffraction. | Li 2 MnO 3 was synthesized by a modifi ed Pechini method from acetate precursors. [ 49 ] The precursor powders, Mn(OCOCH 3 ) 2 ·4H 2 O and Li(OCOCH 3 )·H 2 O were dissolved in an aqueous mixture of ethylene glycol and citric acid (molar ratio 4:1). The mole ratio of ethylene glycol and Mn 2 + was 10:1. Dissolution of reagents was completed by heating to 90 °C with constant stirring followed by a temperature increase to 140 ° C to promote esterifi cation. Subsequently, the temperature was increased to 180 ° C and maintained for 12 h, during which period the polyester formed. Then, the temperature was increased to 250 °C and held for 6 h during which the ethylene glycol dried out and the material caramelized. Calcination at 450 °C for 5 h decomposed the precursors and formed Li 2 MnO 3 . The calcined Li 2 MnO 3 powder was pressed into pellets and annealed at 600 °C for 12 h. The annealed material was characterized for phase purity by X-ray diffraction. | |
| medium | 10 | 162 | text | body_candidate_excluded | after_back_matter_stop | after_back_matter_stop | after_stop | p10:body_region:1 | p10:page_body:column_2_of_2:white | [255, 255, 255] white | [302.01, 222.94, 242.95, 196.79] | The cathodes for electrochemical characterization were prepared by mixing 80 wt% active material, 10 wt% carbon black, and 10 wt% of a solution of polyvinylidene di-fl uoride in N -methyl-2-pyrrolidone acting as a binder. The mixture was applied to an aluminum current collector. Electrochemical measurements were carried out in threeelectrode Swagelok cells using metallic lithium as a counter and reference electrode. A mixture of ethylene carbonate (EC) and dimethyl carbonate (DMC) (1:1 V/V) containing 1 m LiPF 6 was used as electrolyte and a glass fi ber fi lter (Whatman GF/D) as separator. The cells were cycled between 2 V and 5 V vs. Li/Li + with a constant current density of 4.6 mA g -1 (i.e., C/50 with 1C = 230 mA g -1 ) during the fi rst charge and of 23 mA g -1 (i.e., C/10) during the subsequent cycles using a Maccor Series 4000 battery testing unit. The open circuit voltage (OCV) of the cell was measured to be ≈ 4.3 V for the charged states and ≈ 2.2 V for the discharged states. The cells were opened in a dry room and cathodes were washed with DMC solution. The active material was scraped off the aluminum current collector and ground using mortar and pestle. The fi nely ground powder was uniformly applied to the adhesive-coated Kapton tape using a brush. The powder-coated Kapton tape was cut into several pieces which were stacked on top of each other to form a thin, uniform transmission XAS sample. | The cathodes for electrochemical characterization were prepared by mixing 80 wt% active material, 10 wt% carbon black, and 10 wt% of a solution of polyvinylidene di-fl uoride in N -methyl-2-pyrrolidone acting as a binder. The mixture was applied to an aluminum current collector. Electrochemical measurements were carried out in threeelectrode Swagelok cells using metallic lithium as a counter and reference electrode. A mixture of ethylene carbonate (EC) and dimethyl carbonate (DMC) (1:1 V/V) containing 1 m LiPF 6 was used as electrolyte and a glass fi ber fi lter (Whatman GF/D) as separator. The cells were cycled between 2 V and 5 V vs. Li/Li + with a constant current density of 4.6 mA g -1 (i.e., C/50 with 1C = 230 mA g -1 ) during the fi rst charge and of 23 mA g -1 (i.e., C/10) during the subsequent cycles using a Maccor Series 4000 battery testing unit. The open circuit voltage (OCV) of the cell was measured to be ≈ 4.3 V for the charged states and ≈ 2.2 V for the discharged states. The cells were opened in a dry room and cathodes were washed with DMC solution. The active material was scraped off the aluminum current collector and ground using mortar and pestle. The fi nely ground powder was uniformly applied to the adhesive-coated Kapton tape using a brush. The powder-coated Kapton tape was cut into several pieces which were stacked on top of each other to form a thin, uniform transmission XAS sample. | |
| medium | 10 | 163 | text | body_candidate_excluded | after_back_matter_stop | after_back_matter_stop | after_stop | p10:body_region:1 | p10:page_body:column_2_of_2:white | [255, 255, 255] white | [302.01, 422.44, 242.95, 215.79] | XAS measurements were carried out in the transmission mode at the Mn K-edge of various Li 2 MnO 3 samples. The samples charged and discharged during the fi rst cycle were measured at beamline A1 of the Hamburger Synchrotron Radiation Laboratory (HASYLAB), Hamburg, Germany, while those made during the 33 rd cycle were measured at beamline KMC-2 of the BESSY-II synchrotron light source, Berlin, Germany. The former is equipped with a Si (111) double crystal monochromator, while the latter has a graded Si-Ge (111) double crystal monochromator. Higher harmonics were rejected by detuning the monochromator such that the intensity of the beam on the sample was 65% of the maximum possible intensity. Absolute energy calibration of the monochromator was carried out by measuring a reference foil of pure manganese simultaneously with the sample. The intensities of the incident beam and beams transmitted through the sample and the reference foil were measured using gas-fi lled ionization chambers. The incident beam of 4 mm width and 1 mm height was used at both beamlines. Thus, any structural or compositional inhomogeneities within the individual particle of active material inside the illuminated sample volume were averaged over the entire spectrum. Besides Li 2 MnO 3 samples of interest, various manganese reference compounds such as MnO, Mn 2 O 3 , LiMn 2 O 4 , MnO 2 -Pyrolusite, and KMnO 4 were also measured. All spectra were energy-calibrated with respect to the fi rst peak in the derivative spectrum of pure manganese. | XAS measurements were carried out in the transmission mode at the Mn K-edge of various Li 2 MnO 3 samples. The samples charged and discharged during the fi rst cycle were measured at beamline A1 of the Hamburger Synchrotron Radiation Laboratory (HASYLAB), Hamburg, Germany, while those made during the 33 rd cycle were measured at beamline KMC-2 of the BESSY-II synchrotron light source, Berlin, Germany. The former is equipped with a Si (111) double crystal monochromator, while the latter has a graded Si-Ge (111) double crystal monochromator. Higher harmonics were rejected by detuning the monochromator such that the intensity of the beam on the sample was 65% of the maximum possible intensity. Absolute energy calibration of the monochromator was carried out by measuring a reference foil of pure manganese simultaneously with the sample. The intensities of the incident beam and beams transmitted through the sample and the reference foil were measured using gas-fi lled ionization chambers. The incident beam of 4 mm width and 1 mm height was used at both beamlines. Thus, any structural or compositional inhomogeneities within the individual particle of active material inside the illuminated sample volume were averaged over the entire spectrum. Besides Li 2 MnO 3 samples of interest, various manganese reference compounds such as MnO, Mn 2 O 3 , LiMn 2 O 4 , MnO 2 -Pyrolusite, and KMnO 4 were also measured. All spectra were energy-calibrated with respect to the fi rst peak in the derivative spectrum of pure manganese. | |
| medium | 10 | 164 | text | body_candidate_excluded | after_back_matter_stop | after_back_matter_stop | after_stop | p10:body_region:1 | p10:page_body:column_2_of_2:white | [255, 255, 255] white | [302.01, 640.94, 242.95, 74.07] | Various data pre-processing operations such as deglitching, averaging the scans, energy calibration, normalization, background subtraction etc., [ 50 ] were performed using the software ATHENA of the package IFEFFIT . [ 51 ] The normalized component of the EXAFS signal was transformed to k -space and the resultant χ ( k ) signal was multiplied by k 3 to emphasize the data at high k . The k 3 -weighted χ ( k ) signal was then Fourier transformed and left uncorrected for a phase shift. The theoretical χ ( k ) was generated by performing ab initio calculations | Various data pre-processing operations such as deglitching, averaging the scans, energy calibration, normalization, background subtraction etc., [ 50 ] were performed using the software ATHENA of the package IFEFFIT . [ 51 ] The normalized component of the EXAFS signal was transformed to k -space and the resultant χ ( k ) signal was multiplied by k 3 to emphasize the data at high k . The k 3 -weighted χ ( k ) signal was then Fourier transformed and left uncorrected for a phase shift. The theoretical χ ( k ) was generated by performing ab initio calculations | |
| medium | 11 | 167 | text | body_candidate_excluded | after_back_matter_stop | after_back_matter_stop | after_stop | p11:body_region:0 | p11:page_body:left_crossing:white | [255, 255, 255] white | [50.63, 70.67, 243.36, 302.53] | using the code FEFF8.2. [ 52 ] The model function was least-square fi tted to the data using the software ARTEMIS of the package IFEFFIT which uses the algorithm FEFFIT. [ 51 ] The fi tting parameters involved a single amplitude reduction factor ( S 2 0 ) and an overall energy parameter ( ∆ E 0 ) for each data set. S 2 0 accounts for damping of EXAFS signals as a result of multi-electron excitations or many-body effects. [ 53-55 ] S 2 0 is less than 1 and it remains constant for given absorbing atoms over the k-range used for EXAFS analysis. [ 55 ] The origin of EXAFS signal in k -space (i.e., k = 0) is defi ned by the threshold energy, E 0 . Unfortunately, there is no simple way to determine E 0 from the observed experimental spectrum. Therefore, E 0 is chosen arbitrarily for the experimental data. On the other hand, a model function is calculated by assuming the theoretical absorption threshold for given electronic level of absorbing atom. Thus, in order to align the phase of theoretical χ ( k ) with that of the experimental one, ∆ E 0 is left as an adjustable parameter in a fi t. [ 55 ] A fractional change in the bond length ( α fi t ) was refi ned for each coordination shell such that a change in the bond length ∆ R was given by ∆ R = α fi t × R theory . Each coordination shell was assigned a separate mean-squared relative displacement parameter ( F 2 ) depending on the type of atoms it contained and its mean distance from the central absorber. The parameters for multiple scattering paths were constrained in terms of those of corresponding single scattering paths. [ 56 ] Various statistical parameters such as χ 2 , reduced chi-square ( P 2 < ) and the R -factor were used to assess the quality of an EXAFS fi t. However, since χ 2 and P 2 < were evaluated based on measurement uncertainties and FEFFIT poorly estimates the true measurement uncertainties, [ 56-58 ] both these parameters do not refl ect the true quality of the fi t. Nevertheless, both χ 2 and P 2 < were used to assess which model fi ts best the data. The statistical quality of the fi t was given by its R -factor, which is independent of measurement uncertainties. [ 56-58 ] A fi t with an R -factor less than 0.02 (i.e., 98% agreement between data and theory) is considered to be a good fi t. [ 56-58 ] | using the code FEFF8.2. [ 52 ] The model function was least-square fi tted to the data using the software ARTEMIS of the package IFEFFIT which uses the algorithm FEFFIT. [ 51 ] The fi tting parameters involved a single amplitude reduction factor ( S 2 0 ) and an overall energy parameter ( ∆ E 0 ) for each data set. S 2 0 accounts for damping of EXAFS signals as a result of multi-electron excitations or many-body effects. [ 53-55 ] S 2 0 is less than 1 and it remains constant for given absorbing atoms over the k-range used for EXAFS analysis. [ 55 ] The origin of EXAFS signal in k -space (i.e., k = 0) is defi ned by the threshold energy, E 0 . Unfortunately, there is no simple way to determine E 0 from the observed experimental spectrum. Therefore, E 0 is chosen arbitrarily for the experimental data. On the other hand, a model function is calculated by assuming the theoretical absorption threshold for given electronic level of absorbing atom. Thus, in order to align the phase of theoretical χ ( k ) with that of the experimental one, ∆ E 0 is left as an adjustable parameter in a fi t. [ 55 ] A fractional change in the bond length ( α fi t ) was refi ned for each coordination shell such that a change in the bond length ∆ R was given by ∆ R = α fi t × R theory . Each coordination shell was assigned a separate mean-squared relative displacement parameter ( F 2 ) depending on the type of atoms it contained and its mean distance from the central absorber. The parameters for multiple scattering paths were constrained in terms of those of corresponding single scattering paths. [ 56 ] Various statistical parameters such as χ 2 , reduced chi-square ( P 2 < ) and the R -factor were used to assess the quality of an EXAFS fi t. However, since χ 2 and P 2 < were evaluated based on measurement uncertainties and FEFFIT poorly estimates the true measurement uncertainties, [ 56-58 ] both these parameters do not refl ect the true quality of the fi t. Nevertheless, both χ 2 and P 2 < were used to assess which model fi ts best the data. The statistical quality of the fi t was given by its R -factor, which is independent of measurement uncertainties. [ 56-58 ] A fi t with an R -factor less than 0.02 (i.e., 98% agreement between data and theory) is considered to be a good fi t. [ 56-58 ] | |
| low | 1 | 0 | text | page_margin_header | document_web_address | document_web_address | p1:body_region:0 | p1:top_margin:column_1_of_2:white | [255, 255, 255] white | [51.01, 53.34, 83.44, 6.78] | www.MaterialsViews.com | |||
| low | 1 | 1 | text | page_margin_header | document_web_address | document_web_address | p1:body_region:1 | p1:top_margin:column_2_of_2:white | [255, 255, 255] white | [473.91, 45.23, 73.35, 6.78] | www.advenergymat.de | |||
| low | 1 | 2 | page_header | page_header | document_ui | document_ui | p1:page_body:column_2_of_2:gray | [145, 146, 150] gray | [571.77, 70.54, 11.89, 80.75] | FULL PAPER | FULL PAPER | |||
| low | 1 | 3 | section_header | title_candidate | non_body_heading | non_body_heading | p1:body_region:0 | p1:page_body:column_1_of_2:white | [255, 255, 255] white | [51.06, 73.52, 411.26, 39.94] | Structural Changes in Li 2 MnO 3 Cathode Material for Li-Ion Batteries | Structural Changes in Li 2 MnO 3 Cathode Material for Li-Ion Batteries | ||
| low | 1 | 6 | section_header | body_heading | body_heading | body_heading | p1:body_region:0 | p1:page_body:column_1_of_2:white | [255, 255, 255] white | [51.01, 449.89, 73.83, 9.74] | 1 . Introduction | 1 . Introduction | ||
| low | 1 | 9 | text | metadata | first_page_metadata | first_page_metadata | p1:body_region:0 | p1:page_body:column_1_of_2:white | [255, 255, 255] white | [51.01, 710.51, 119.31, 7.62] | DOI: 10.1002/aenm.201300998 | DOI: 10.1002/aenm.201300998 | ||
| low | 1 | 10 | page_footer | page_footer | first_page_metadata | first_page_metadata | p1:body_region:0 | p1:bottom_margin:column_1_of_2:white | [255, 255, 255] white | [185.77, 742.91, 169.97, 6.29] | © 2013 WILEY-VCH Verlag GmbH & Co. KGaA, Weinheim | © 2013 WILEY-VCH Verlag GmbH & Co. KGaA, Weinheim | ||
| low | 1 | 11 | page_footer | page_footer | docling_page_footer | docling_page_footer | p1:body_region:0 | p1:bottom_margin:column_1_of_2:white | [255, 255, 255] white | [51.06, 743.21, 104.16, 5.94] | Adv. Energy Mater . 2014 , 4 , 1300998 | Adv. Energy Mater . 2014 , 4 , 1300998 | ||
| low | 1 | 16 | page_footer | page_footer | docling_page_footer | docling_page_footer | p1:body_region:1 | p1:bottom_margin:column_2_of_2:white | [255, 255, 255] white | [494.78, 741.91, 67.85, 7.64] | (1 of 12) 1300998 | (1 of 12) 1300998 | ||
| low | 1 | 17 | page_footer | page_footer | document_web_address | document_web_address | p1:body_region:1 | p1:bottom_margin:column_2_of_2:white | [255, 255, 255] white | [388.05, 743.22, 64.38, 5.93] | wileyonlinelibrary.com | wileyonlinelibrary.com | ||
| low | 2 | 18 | text | page_margin_header | page_margin_header | page_margin_header | p2:body_region:0 | p2:top_margin:column_1_of_2:white | [255, 255, 255] white | [46.91, 45.16, 73.33, 6.78] | www.advenergymat.de | |||
| low | 2 | 19 | page_header | page_header | docling_page_header | docling_page_header | p2:front_matter:front_panel:gray | [164, 165, 168] gray | [10.31, 70.11, 11.89, 80.75] | FULL PAPER | FULL PAPER | |||
| low | 2 | 20 | page_header | page_header | docling_page_header | docling_page_header | p2:top_margin:column_2_of_2:white | [253, 253, 253] white | [577.94, 15.66, 4.29, 743.12] | 16146840, 2014, 5, Downloaded from https://advanced.onlinelibrary.wiley.com/doi/10.1002/aenm.201300998 by Jilin University, Wiley Online Library on [11/07/2026]. See the Terms and Conditions (https://onlinelibrary.wiley.com/terms-and-conditions) on Wiley Online Library for rules of use; OA articles are governed by the applicable Creative Commons License | ||||
| low | 2 | 21 | text | page_margin_header | page_margin_header | page_margin_header | p2:body_region:1 | p2:top_margin:column_2_of_2:white | [255, 255, 255] white | [457.98, 53.43, 83.44, 6.78] | www.MaterialsViews.com | |||
| low | 2 | 22 | caption | caption | outside_body_flow_caption | outside_body_flow_caption | p2:body_region:0 | p2:front_matter:column_1_of_2:white | [255, 255, 255] white | [46.9, 254.03, 498.08, 17.53] | Figure 1. a) Charge-discharge profi les of Li 2 MnO 3 when cycled between 2.0 V and 5.0 V during the fi rst and 33 rd cycles. b) Charge-discharge capacities obtained during each cycle along with electrochemical effi ciency. | Figure 1. a) Charge-discharge profi les of Li 2 MnO 3 when cycled between 2.0 V and 5.0 V during the fi rst and 33 rd cycles. b) Charge-discharge capacities obtained during each cycle along with electrochemical effi ciency. | ||
| low | 2 | 24 | section_header | body_heading | body_heading | body_heading | p2:body_region:0 | p2:body_zone:column_1_of_2:white | [255, 255, 255] white | [46.9, 363.28, 49.62, 9.74] | 2 . Results | 2 . Results | ||
| low | 2 | 27 | section_header | body_heading | body_heading | body_heading | p2:body_region:1 | p2:body_zone:column_2_of_2:white | [255, 255, 255] white | [302.03, 358.41, 45.23, 7.62] | 2.1 . XANES | 2.1 . XANES | ||
| low | 2 | 29 | caption | caption | outside_body_flow_caption | outside_body_flow_caption | p2:body_region:0 | p2:body_zone:column_1_of_2:white | [255, 255, 255] white | [46.9, 691.43, 498.08, 25.79] | Figure 2. a) Normalized absorption spectra for various manganese reference compounds with the inset showing an enlarged pre-edge region of four compounds. b) Variation in the position of the 1s → 4p peak (dashed blue line) and the average metal-ligand bond length (solid red line) for these compounds. | Figure 2. a) Normalized absorption spectra for various manganese reference compounds with the inset showing an enlarged pre-edge region of four compounds. b) Variation in the position of the 1s → 4p peak (dashed blue line) and the average metal-ligand bond length (solid red line) for these compounds. | ||
| low | 2 | 30 | page_footer | page_footer | docling_page_footer | docling_page_footer | p2:body_region:0 | p2:bottom_margin:column_1_of_2:white | [255, 255, 255] white | [32.48, 741.91, 67.86, 7.64] | 1300998 (2 of 12) | 1300998 (2 of 12) | ||
| low | 2 | 31 | page_footer | page_footer | docling_page_footer | docling_page_footer | p2:body_region:0 | p2:bottom_margin:column_1_of_2:white | [255, 255, 255] white | [137.77, 743.22, 64.38, 5.93] | wileyonlinelibrary.com | wileyonlinelibrary.com | ||
| low | 2 | 32 | page_footer | page_footer | docling_page_footer | docling_page_footer | p2:body_region:1 | p2:bottom_margin:column_2_of_2:white | [255, 255, 255] white | [236.51, 742.89, 169.97, 6.29] | © 2013 WILEY-VCH Verlag GmbH & Co. KGaA, Weinheim | © 2013 WILEY-VCH Verlag GmbH & Co. KGaA, Weinheim | ||
| low | 2 | 33 | page_footer | page_footer | docling_page_footer | docling_page_footer | p2:body_region:1 | p2:bottom_margin:column_2_of_2:white | [255, 255, 255] white | [440.0, 743.21, 103.42, 5.94] | Adv. Energy Mater. 2014 , 4 , 1300998 | Adv. Energy Mater. 2014 , 4 , 1300998 | ||
| low | 3 | 34 | text | page_margin_header | page_margin_header | page_margin_header | p3:body_region:0 | p3:top_margin:column_1_of_2:white | [255, 255, 255] white | [51.01, 53.34, 83.44, 6.78] | www.MaterialsViews.com | |||
| low | 3 | 35 | caption | caption | outside_body_flow_caption | outside_body_flow_caption | p3:body_region:0 | p3:front_matter:column_1_of_2:white | [255, 255, 255] white | [50.78, 253.26, 242.95, 25.79] | Figure 3. Normalized absorption spectra for various Li 2 MnO 3 samples along with those of Mn 3 + and Mn 4 + reference compounds. The inset shows the pre-edge region. | Figure 3. Normalized absorption spectra for various Li 2 MnO 3 samples along with those of Mn 3 + and Mn 4 + reference compounds. The inset shows the pre-edge region. | ||
| low | 3 | 38 | text | reference | empty_after_cleaning | empty_after_cleaning | p3:top_margin:column_2_of_2:gray | [229, 229, 229] gray | [577.94, 15.66, 4.29, 743.12] | 16146840, 2014, 5, Downloaded from https://advanced.onlinelibrary.wiley.com/doi/10.1002/aenm.201300998 by Jilin University, Wiley Online Library on [11/07/2026]. See the Terms and Conditions (https://onlinelibrary.wiley.com/terms-and-conditions) on Wiley Online Library for rules of use; OA articles are governed by the applicable Creative Commons License | ||||
| low | 3 | 39 | text | page_margin_header | page_margin_header | page_margin_header | p3:body_region:1 | p3:top_margin:column_2_of_2:white | [255, 255, 255] white | [473.91, 45.23, 73.35, 6.78] | www.advenergymat.de | |||
| low | 3 | 40 | page_header | page_header | docling_page_header | docling_page_header | p3:front_matter:front_panel:gray | [127, 129, 133] gray | [571.77, 70.54, 11.89, 80.75] | FULL PAPER | FULL PAPER | |||
| low | 3 | 43 | section_header | body_heading | body_heading | body_heading | p3:body_region:1 | p3:body_zone:column_2_of_2:white | [255, 255, 255] white | [306.15, 257.05, 43.1, 7.62] | 2.2 . EXAFS | 2.2 . EXAFS | ||
| low | 3 | 46 | caption | caption | outside_body_flow_caption | outside_body_flow_caption | p3:body_region:0 | p3:body_zone:column_1_of_2:white | [255, 255, 255] white | [51.04, 698.84, 498.12, 19.15] | Figure 4. a) k 3 -weighted EXAFS signals χ ( k ) and b) their Fourier transforms for Li 2 MnO 3 samples in the pristine state (solid black line), when charged to 5 V during the fi rst cycle (dashed red line) and when charged to 5 V during the 33 rd cycle (dotted blue line). | Figure 4. a) k 3 -weighted EXAFS signals χ ( k ) and b) their Fourier transforms for Li 2 MnO 3 samples in the pristine state (solid black line), when charged to 5 V during the fi rst cycle (dashed red line) and when charged to 5 V during the 33 rd cycle (dotted blue line). | ||
| low | 3 | 47 | page_footer | page_footer | docling_page_footer | docling_page_footer | p3:body_region:0 | p3:bottom_margin:column_1_of_2:white | [255, 255, 255] white | [51.06, 743.21, 104.16, 5.94] | Adv. Energy Mater . 2014 , 4 , 1300998 | Adv. Energy Mater . 2014 , 4 , 1300998 | ||
| low | 3 | 48 | page_footer | page_footer | docling_page_footer | docling_page_footer | p3:body_region:1 | p3:bottom_margin:column_2_of_2:white | [255, 255, 255] white | [494.77, 741.91, 67.86, 7.64] | (3 of 12) 1300998 | (3 of 12) 1300998 | ||
| low | 3 | 49 | page_footer | page_footer | docling_page_footer | docling_page_footer | p3:body_region:0 | p3:bottom_margin:column_2_of_2:white | [255, 255, 255] white | [185.77, 742.91, 169.97, 6.29] | © 2013 WILEY-VCH Verlag GmbH & Co. KGaA, Weinheim | © 2013 WILEY-VCH Verlag GmbH & Co. KGaA, Weinheim | ||
| low | 3 | 50 | page_footer | page_footer | docling_page_footer | docling_page_footer | p3:body_region:1 | p3:bottom_margin:column_2_of_2:white | [255, 255, 255] white | [388.05, 743.22, 64.38, 5.93] | wileyonlinelibrary.com | wileyonlinelibrary.com | ||
| low | 4 | 51 | text | page_margin_header | page_margin_header | page_margin_header | p4:body_region:0 | p4:top_margin:column_1_of_2:white | [255, 255, 255] white | [46.91, 45.16, 73.33, 6.78] | www.advenergymat.de | |||
| low | 4 | 52 | page_header | page_header | docling_page_header | docling_page_header | p4:page_body:column_1_of_2:gray | [164, 165, 168] gray | [10.31, 70.11, 11.89, 80.75] | FULL PAPER | FULL PAPER | |||
| low | 4 | 53 | page_header | page_header | docling_page_header | docling_page_header | p4:top_margin:column_2_of_2:white | [253, 253, 253] white | [577.94, 15.66, 4.29, 743.12] | 16146840, 2014, 5, Downloaded from https://advanced.onlinelibrary.wiley.com/doi/10.1002/aenm.201300998 by Jilin University, Wiley Online Library on [11/07/2026]. See the Terms and Conditions (https://onlinelibrary.wiley.com/terms-and-conditions) on Wiley Online Library for rules of use; OA articles are governed by the applicable Creative Commons License | ||||
| low | 4 | 54 | text | page_margin_header | page_margin_header | page_margin_header | p4:body_region:1 | p4:top_margin:column_2_of_2:white | [255, 255, 255] white | [457.98, 53.43, 83.44, 6.78] | www.MaterialsViews.com | |||
| low | 4 | 55 | caption | caption | outside_body_flow_caption | outside_body_flow_caption | p4:body_region:0 | p4:page_body:column_1_of_2:white | [255, 255, 255] white | [46.88, 251.21, 496.08, 19.15] | Figure 5. a) k 3 -weighted EXAFS signals χ ( k ) and b) their Fourier transforms for Li 2 MnO 3 samples in the pristine state (solid black line), when discharged to 2 V during the fi rst cycle (dashed red line) and when discharged to 2 V during the 33 rd cycle (dotted blue line). | Figure 5. a) k 3 -weighted EXAFS signals χ ( k ) and b) their Fourier transforms for Li 2 MnO 3 samples in the pristine state (solid black line), when discharged to 2 V during the fi rst cycle (dashed red line) and when discharged to 2 V during the 33 rd cycle (dotted blue line). | ||
| low | 4 | 57 | caption | caption | outside_body_flow_caption | outside_body_flow_caption | p4:body_region:0 | p4:page_body:column_1_of_2:white | [255, 255, 255] white | [46.9, 701.12, 242.95, 16.29] | Figure 6. EXAFS fi t to the data of Li 2 MnO 3 sample in the pristine state. The dotted lines indicate the fi tting range. | Figure 6. EXAFS fi t to the data of Li 2 MnO 3 sample in the pristine state. The dotted lines indicate the fi tting range. | ||
| low | 4 | 58 | page_footer | page_footer | docling_page_footer | docling_page_footer | p4:body_region:0 | p4:bottom_margin:column_1_of_2:white | [255, 255, 255] white | [32.48, 741.91, 67.86, 7.64] | 1300998 (4 of 12) | 1300998 (4 of 12) | ||
| low | 4 | 59 | page_footer | page_footer | docling_page_footer | docling_page_footer | p4:body_region:0 | p4:bottom_margin:column_1_of_2:white | [255, 255, 255] white | [137.77, 743.22, 64.38, 5.93] | wileyonlinelibrary.com | wileyonlinelibrary.com | ||
| low | 4 | 63 | page_footer | page_footer | docling_page_footer | docling_page_footer | p4:body_region:1 | p4:bottom_margin:column_2_of_2:white | [255, 255, 255] white | [236.51, 742.89, 169.97, 6.29] | © 2013 WILEY-VCH Verlag GmbH & Co. KGaA, Weinheim | © 2013 WILEY-VCH Verlag GmbH & Co. KGaA, Weinheim | ||
| low | 4 | 64 | page_footer | page_footer | docling_page_footer | docling_page_footer | p4:body_region:1 | p4:bottom_margin:column_2_of_2:white | [255, 255, 255] white | [440.0, 743.21, 103.42, 5.94] | Adv. Energy Mater. 2014 , 4 , 1300998 | Adv. Energy Mater. 2014 , 4 , 1300998 | ||
| low | 5 | 65 | text | page_margin_header | page_margin_header | page_margin_header | p5:body_region:0 | p5:top_margin:column_1_of_2:white | [255, 255, 255] white | [51.01, 53.34, 83.44, 6.78] | www.MaterialsViews.com | |||
| low | 5 | 66 | text | reference | empty_after_cleaning | empty_after_cleaning | p5:top_margin:column_2_of_2:gray | [229, 229, 229] gray | [577.94, 15.66, 4.29, 743.12] | 16146840, 2014, 5, Downloaded from https://advanced.onlinelibrary.wiley.com/doi/10.1002/aenm.201300998 by Jilin University, Wiley Online Library on [11/07/2026]. See the Terms and Conditions (https://onlinelibrary.wiley.com/terms-and-conditions) on Wiley Online Library for rules of use; OA articles are governed by the applicable Creative Commons License | ||||
| low | 5 | 67 | text | page_margin_header | page_margin_header | page_margin_header | p5:top_margin:column_2_of_2:white | [255, 255, 255] white | [473.91, 45.23, 73.35, 6.78] | www.advenergymat.de | ||||
| low | 5 | 68 | text | metadata | document_ui | document_ui | p5:page_body:column_2_of_2:gray | [127, 129, 133] gray | [571.77, 70.54, 11.89, 80.75] | FULL PAPER | FULL PAPER | |||
| low | 5 | 69 | caption | caption | outside_body_flow_caption | outside_body_flow_caption | p5:body_region:0 | p5:page_body:column_1_of_2:white | [255, 255, 255] white | [51.04, 253.82, 433.44, 7.92] | Figure 7. EXAFS fi ts to the data of Li 2 MnO 3 samples a) when charged to 5 V and b) when discharged to 2 V during the fi rst cycle. | Figure 7. EXAFS fi ts to the data of Li 2 MnO 3 samples a) when charged to 5 V and b) when discharged to 2 V during the fi rst cycle. | ||
| low | 5 | 72 | caption | caption | outside_body_flow_caption | outside_body_flow_caption | p5:page_body:column_2_of_2:white | [255, 255, 255] white | [306.15, 462.93, 150.69, 7.92] | Figure 8. EXAFS data of the LiMn 2 O 4 spinel. | Figure 8. EXAFS data of the LiMn 2 O 4 spinel. | |||
| low | 5 | 73 | text | back_matter_heading | back_matter_heading | back_matter_heading | stop_trigger | p5:page_body:column_2_of_2:white | [255, 255, 255] white | [306.15, 489.61, 243.2, 31.71] | Supporting Information) with a good agreement with the data as shown in Figure 9 a. Similarly, the EXAFS data of the cycleddischarged sample were explained by a Li 2 MnO 3 structure | Supporting Information) with a good agreement with the data as shown in Figure 9 a. Similarly, the EXAFS data of the cycleddischarged sample were explained by a Li 2 MnO 3 structure | ||
| low | 5 | 74 | caption | caption | after_back_matter_stop | after_back_matter_stop | after_stop | p5:body_region:0 | p5:bottom_margin:column_1_of_2:white | [255, 255, 255] white | [51.04, 714.14, 433.62, 9.15] | Figure 9. EXAFS fi ts to the data of Li 2 MnO 3 samples a) when charged to 5 V and b) when discharged to 2 V during the 33 rd cycle. | Figure 9. EXAFS fi ts to the data of Li 2 MnO 3 samples a) when charged to 5 V and b) when discharged to 2 V during the 33 rd cycle. | |
| low | 5 | 75 | page_footer | page_footer | after_back_matter_stop | after_back_matter_stop | after_stop | p5:body_region:0 | p5:bottom_margin:column_1_of_2:white | [255, 255, 255] white | [51.06, 743.21, 104.16, 5.94] | Adv. Energy Mater . 2014 , 4 , 1300998 | Adv. Energy Mater . 2014 , 4 , 1300998 | |
| low | 5 | 76 | page_footer | page_footer | after_back_matter_stop | after_back_matter_stop | after_stop | p5:bottom_margin:column_2_of_2:white | [255, 255, 255] white | [494.77, 741.91, 67.86, 7.64] | (5 of 12) 1300998 | (5 of 12) 1300998 | ||
| low | 5 | 77 | page_footer | page_footer | after_back_matter_stop | after_back_matter_stop | after_stop | p5:body_region:0 | p5:bottom_margin:column_2_of_2:white | [255, 255, 255] white | [185.77, 742.91, 169.97, 6.29] | © 2013 WILEY-VCH Verlag GmbH & Co. KGaA, Weinheim | © 2013 WILEY-VCH Verlag GmbH & Co. KGaA, Weinheim | |
| low | 5 | 78 | page_footer | page_footer | after_back_matter_stop | after_back_matter_stop | after_stop | p5:bottom_margin:column_2_of_2:white | [255, 255, 255] white | [388.05, 743.22, 64.38, 5.93] | wileyonlinelibrary.com | wileyonlinelibrary.com | ||
| low | 6 | 79 | text | page_margin_header | after_back_matter_stop | after_back_matter_stop | after_stop | p6:body_region:0 | p6:top_margin:column_1_of_2:white | [255, 255, 255] white | [46.91, 45.16, 73.33, 6.78] | www.advenergymat.de | ||
| low | 6 | 80 | page_header | page_header | after_back_matter_stop | after_back_matter_stop | after_stop | p6:front_matter:front_panel:gray | [164, 165, 168] gray | [10.31, 70.11, 11.89, 80.75] | FULL PAPER | FULL PAPER | ||
| low | 6 | 81 | caption | caption | after_back_matter_stop | after_back_matter_stop | after_stop | p6:body_region:0 | p6:front_matter:column_1_of_2:white | [255, 255, 255] white | [46.9, 253.7, 242.95, 54.29] | Figure 10. Comparison of the metal-ligand bond length for the electrochemically cycled Li 2 MnO 3 samples during the fi rst and 33 rd cycles. The asterisk (*) represents the charged-discharged samples during the 33 rd cycle. The solid line indicates the average Mn 4 + -O bond length obtained by fi tting the EXAFS data of the MnO 2 reference compound and dotted lines indicate statistical uncertainties of the fi tted value. | Figure 10. Comparison of the metal-ligand bond length for the electrochemically cycled Li 2 MnO 3 samples during the fi rst and 33 rd cycles. The asterisk (*) represents the charged-discharged samples during the 33 rd cycle. The solid line indicates the average Mn 4 + -O bond length obtained by fi tting the EXAFS data of the MnO 2 reference compound and dotted lines indicate statistical uncertainties of the fi tted value. | |
| low | 6 | 85 | caption | caption | after_back_matter_stop | after_back_matter_stop | after_stop | p6:body_region:0 | p6:body_zone:column_1_of_2:white | [255, 255, 255] white | [46.9, 709.82, 421.8, 9.15] | Figure 11. Structural disorder in charged-discharged samples of Li 2 MnO 3 a) during the fi rst cycle and b) during the 33 rd cycle. | Figure 11. Structural disorder in charged-discharged samples of Li 2 MnO 3 a) during the fi rst cycle and b) during the 33 rd cycle. | |
| low | 6 | 86 | page_footer | page_footer | after_back_matter_stop | after_back_matter_stop | after_stop | p6:body_region:0 | p6:bottom_margin:column_1_of_2:white | [255, 255, 255] white | [32.48, 741.91, 67.86, 7.64] | 1300998 (6 of 12) | 1300998 (6 of 12) | |
| low | 6 | 87 | page_footer | page_footer | after_back_matter_stop | after_back_matter_stop | after_stop | p6:body_region:0 | p6:bottom_margin:column_1_of_2:white | [255, 255, 255] white | [137.77, 743.22, 64.38, 5.93] | wileyonlinelibrary.com | wileyonlinelibrary.com | |
| low | 6 | 88 | page_header | page_header | after_back_matter_stop | after_back_matter_stop | after_stop | p6:top_margin:column_2_of_2:white | [253, 253, 253] white | [577.94, 15.66, 4.29, 743.12] | 16146840, 2014, 5, Downloaded from https://advanced.onlinelibrary.wiley.com/doi/10.1002/aenm.201300998 by Jilin University, Wiley Online Library on [11/07/2026]. See the Terms and Conditions (https://onlinelibrary.wiley.com/terms-and-conditions) on Wiley Online Library for rules of use; OA articles are governed by the applicable Creative Commons License | |||
| low | 6 | 89 | text | page_margin_header | after_back_matter_stop | after_back_matter_stop | after_stop | p6:body_region:1 | p6:top_margin:column_2_of_2:white | [255, 255, 255] white | [457.98, 53.43, 83.44, 6.78] | www.MaterialsViews.com | ||
| low | 6 | 92 | section_header | unknown_text | after_back_matter_stop | after_back_matter_stop | after_stop | p6:body_region:1 | p6:front_matter:column_2_of_2:white | [255, 255, 255] white | [302.01, 267.42, 67.53, 9.74] | 3 . Discussion | 3 . Discussion | |
| low | 6 | 93 | section_header | body_heading | after_back_matter_stop | after_back_matter_stop | after_stop | p6:body_region:1 | p6:body_zone:column_2_of_2:white | [255, 255, 255] white | [302.01, 287.8, 45.23, 7.62] | 3.1 . XANES | 3.1 . XANES | |
| low | 6 | 95 | page_footer | page_footer | after_back_matter_stop | after_back_matter_stop | after_stop | p6:body_region:1 | p6:bottom_margin:column_2_of_2:white | [255, 255, 255] white | [236.51, 742.89, 169.97, 6.29] | © 2013 WILEY-VCH Verlag GmbH & Co. KGaA, Weinheim | © 2013 WILEY-VCH Verlag GmbH & Co. KGaA, Weinheim | |
| low | 6 | 96 | page_footer | page_footer | after_back_matter_stop | after_back_matter_stop | after_stop | p6:body_region:1 | p6:bottom_margin:column_2_of_2:white | [255, 255, 255] white | [440.0, 743.21, 103.42, 5.94] | Adv. Energy Mater. 2014 , 4 , 1300998 | Adv. Energy Mater. 2014 , 4 , 1300998 | |
| low | 7 | 97 | text | page_margin_header | after_back_matter_stop | after_back_matter_stop | after_stop | p7:body_region:0 | p7:top_margin:column_1_of_2:white | [255, 255, 255] white | [51.01, 53.34, 83.44, 6.78] | www.MaterialsViews.com | ||
| low | 7 | 100 | section_header | body_heading | after_back_matter_stop | after_back_matter_stop | after_stop | p7:body_region:0 | p7:body_zone:column_1_of_2:white | [255, 255, 255] white | [51.04, 576.0, 43.1, 7.62] | 3.2 . EXAFS | 3.2 . EXAFS | |
| low | 7 | 101 | section_header | body_heading | after_back_matter_stop | after_back_matter_stop | after_stop | p7:body_region:0 | p7:body_zone:column_1_of_2:white | [255, 255, 255] white | [51.04, 603.08, 179.46, 7.46] | 3.2.1 . Structural Changes During the First Charge | 3.2.1 . Structural Changes During the First Charge | |
| low | 7 | 103 | page_footer | page_footer | after_back_matter_stop | after_back_matter_stop | after_stop | p7:body_region:0 | p7:bottom_margin:column_1_of_2:white | [255, 255, 255] white | [51.06, 743.21, 104.16, 5.94] | Adv. Energy Mater . 2014 , 4 , 1300998 | Adv. Energy Mater . 2014 , 4 , 1300998 | |
| low | 7 | 104 | text | reference | after_back_matter_stop | after_back_matter_stop | after_stop | p7:top_margin:column_2_of_2:gray | [229, 229, 229] gray | [577.94, 15.66, 4.29, 743.12] | 16146840, 2014, 5, Downloaded from https://advanced.onlinelibrary.wiley.com/doi/10.1002/aenm.201300998 by Jilin University, Wiley Online Library on [11/07/2026]. See the Terms and Conditions (https://onlinelibrary.wiley.com/terms-and-conditions) on Wiley Online Library for rules of use; OA articles are governed by the applicable Creative Commons License | |||
| low | 7 | 105 | text | page_margin_header | after_back_matter_stop | after_back_matter_stop | after_stop | p7:body_region:1 | p7:top_margin:column_2_of_2:white | [255, 255, 255] white | [473.91, 45.23, 73.35, 6.78] | www.advenergymat.de | ||
| low | 7 | 106 | page_header | page_header | after_back_matter_stop | after_back_matter_stop | after_stop | p7:front_matter:front_panel:gray | [127, 129, 133] gray | [571.77, 70.54, 11.89, 80.75] | FULL PAPER | FULL PAPER | ||
| low | 7 | 112 | page_footer | page_footer | after_back_matter_stop | after_back_matter_stop | after_stop | p7:body_region:1 | p7:bottom_margin:column_2_of_2:white | [255, 255, 255] white | [494.77, 741.91, 67.86, 7.64] | (7 of 12) 1300998 | (7 of 12) 1300998 | |
| low | 7 | 113 | page_footer | page_footer | after_back_matter_stop | after_back_matter_stop | after_stop | p7:body_region:0 | p7:bottom_margin:column_2_of_2:white | [255, 255, 255] white | [185.77, 742.91, 169.97, 6.29] | © 2013 WILEY-VCH Verlag GmbH & Co. KGaA, Weinheim | © 2013 WILEY-VCH Verlag GmbH & Co. KGaA, Weinheim | |
| low | 7 | 114 | page_footer | page_footer | after_back_matter_stop | after_back_matter_stop | after_stop | p7:body_region:1 | p7:bottom_margin:column_2_of_2:white | [255, 255, 255] white | [388.05, 743.22, 64.38, 5.93] | wileyonlinelibrary.com | wileyonlinelibrary.com | |
| low | 8 | 115 | text | page_margin_header | after_back_matter_stop | after_back_matter_stop | after_stop | p8:body_region:0 | p8:top_margin:column_1_of_2:white | [255, 255, 255] white | [46.91, 45.16, 73.33, 6.78] | www.advenergymat.de | ||
| low | 8 | 116 | page_header | page_header | after_back_matter_stop | after_back_matter_stop | after_stop | p8:front_matter:front_panel:gray | [164, 165, 168] gray | [10.31, 70.11, 11.89, 80.75] | FULL PAPER | FULL PAPER | ||
| low | 8 | 117 | page_header | page_header | after_back_matter_stop | after_back_matter_stop | after_stop | p8:top_margin:column_2_of_2:white | [253, 253, 253] white | [577.94, 15.66, 4.29, 743.12] | 16146840, 2014, 5, Downloaded from https://advanced.onlinelibrary.wiley.com/doi/10.1002/aenm.201300998 by Jilin University, Wiley Online Library on [11/07/2026]. See the Terms and Conditions (https://onlinelibrary.wiley.com/terms-and-conditions) on Wiley Online Library for rules of use; OA articles are governed by the applicable Creative Commons License | |||
| low | 8 | 118 | text | page_margin_header | after_back_matter_stop | after_back_matter_stop | after_stop | p8:body_region:1 | p8:top_margin:column_2_of_2:white | [255, 255, 255] white | [457.98, 53.43, 83.44, 6.78] | www.MaterialsViews.com | ||
| low | 8 | 119 | caption | caption | after_back_matter_stop | after_back_matter_stop | after_stop | p8:body_region:0 | p8:front_matter:column_1_of_2:white | [255, 255, 255] white | [46.88, 221.33, 498.07, 19.07] | Figure 12. Stacking sequence of close-packed oxygen layers in a) O3 structure of Li 2 MnO 3 ( C2 / m ) [ 22 ] and b) P3 structure ( R 3 m ) of proton-exchanged material. [ 59 ] Note that O-H-O bonds are asymmetric in the P3 structure. | Figure 12. Stacking sequence of close-packed oxygen layers in a) O3 structure of Li 2 MnO 3 ( C2 / m ) [ 22 ] and b) P3 structure ( R 3 m ) of proton-exchanged material. [ 59 ] Note that O-H-O bonds are asymmetric in the P3 structure. | |
| low | 8 | 121 | section_header | body_heading | after_back_matter_stop | after_back_matter_stop | after_stop | p8:body_region:0 | p8:body_zone:column_1_of_2:white | [255, 255, 255] white | [46.9, 550.5, 189.09, 7.46] | 3.2.2 . Structural Changes During the First Discharge | 3.2.2 . Structural Changes During the First Discharge | |
| low | 8 | 123 | page_footer | page_footer | after_back_matter_stop | after_back_matter_stop | after_stop | p8:body_region:0 | p8:bottom_margin:column_1_of_2:white | [255, 255, 255] white | [32.48, 741.91, 67.86, 7.64] | 1300998 (8 of 12) | 1300998 (8 of 12) | |
| low | 8 | 124 | page_footer | page_footer | after_back_matter_stop | after_back_matter_stop | after_stop | p8:body_region:0 | p8:bottom_margin:column_1_of_2:white | [255, 255, 255] white | [137.77, 743.22, 64.38, 5.93] | wileyonlinelibrary.com | wileyonlinelibrary.com | |
| low | 8 | 129 | text | unknown_text | after_back_matter_stop | after_back_matter_stop | after_stop | p8:body_region:1 | p8:body_zone:column_2_of_2:white | [255, 255, 255] white | [532.89, 707.66, 12.31, 8.52] | (3) | (3) | |
| low | 8 | 130 | page_footer | page_footer | after_back_matter_stop | after_back_matter_stop | after_stop | p8:body_region:1 | p8:bottom_margin:column_2_of_2:white | [255, 255, 255] white | [236.51, 742.89, 169.97, 6.29] | © 2013 WILEY-VCH Verlag GmbH & Co. KGaA, Weinheim | © 2013 WILEY-VCH Verlag GmbH & Co. KGaA, Weinheim | |
| low | 8 | 131 | page_footer | page_footer | after_back_matter_stop | after_back_matter_stop | after_stop | p8:body_region:1 | p8:bottom_margin:column_2_of_2:white | [255, 255, 255] white | [440.0, 743.21, 103.42, 5.94] | Adv. Energy Mater. 2014 , 4 , 1300998 | Adv. Energy Mater. 2014 , 4 , 1300998 | |
| low | 9 | 132 | text | page_margin_header | after_back_matter_stop | after_back_matter_stop | after_stop | p9:body_region:0 | p9:top_margin:column_1_of_2:white | [255, 255, 255] white | [51.01, 53.34, 83.44, 6.78] | www.MaterialsViews.com | ||
| low | 9 | 134 | section_header | body_heading | after_back_matter_stop | after_back_matter_stop | after_stop | p9:body_region:0 | p9:body_zone:column_1_of_2:white | [255, 255, 255] white | [51.04, 141.98, 142.93, 7.46] | 3.2.3 . Structural Changes Upon Cycling | 3.2.3 . Structural Changes Upon Cycling | |
| low | 9 | 135 | text | back_matter_text | after_back_matter_stop | after_back_matter_stop | after_stop | p9:body_region:0 | p9:body_zone:column_1_of_2:white | [255, 255, 255] white | [51.04, 158.18, 243.2, 218.71] | It has been claimed that prolonged cycling of Li 2 MnO 3 gives rise to the formation of LiMn 2 O 4 -type spinel phase. [ 14 ] This claim is supported by qualitative similarities between the electrochemical profi les of cycled Li 2 MnO 3 and LiMn 2 O 4 [ 14 ] and the fact that the formation of LiMn 2 O 4 spinel phase from layered LiMnO 2 that presumably forms during the fi rst discharge is favored. [ 45,46 ] However, the EXAFS data of the discharged sample during the fi rst cycle (Figure 7 b) clearly suggest that Li re-insertion into layered MnO 2 gives rise to the formation of Li 2 MnO 3 -type structure. This result is in confl ict with the existing hypothesis and raises doubts about the formation of a spinel-like phase upon cycling. Previously, Paik et al. [ 25 ] have also expressed ambiguity about the formation of a spinel-like phase upon cycling. Quite contrarily, a transmission electron microscopy (TEM) investigation by Gu et al. [ 47 ] revealed the presence of randomly oriented, extremely small domains of LiMn 2 O 4 -type spinel phase embedded within the amorphous surrounding resulting from the breakdown of the parent lattice of Li 2 MnO 3 upon cycling. Thus, there exist contradicting views about the structural modifi cations in Li 2 MnO 3 upon cycling. | It has been claimed that prolonged cycling of Li 2 MnO 3 gives rise to the formation of LiMn 2 O 4 -type spinel phase. [ 14 ] This claim is supported by qualitative similarities between the electrochemical profi les of cycled Li 2 MnO 3 and LiMn 2 O 4 [ 14 ] and the fact that the formation of LiMn 2 O 4 spinel phase from layered LiMnO 2 that presumably forms during the fi rst discharge is favored. [ 45,46 ] However, the EXAFS data of the discharged sample during the fi rst cycle (Figure 7 b) clearly suggest that Li re-insertion into layered MnO 2 gives rise to the formation of Li 2 MnO 3 -type structure. This result is in confl ict with the existing hypothesis and raises doubts about the formation of a spinel-like phase upon cycling. Previously, Paik et al. [ 25 ] have also expressed ambiguity about the formation of a spinel-like phase upon cycling. Quite contrarily, a transmission electron microscopy (TEM) investigation by Gu et al. [ 47 ] revealed the presence of randomly oriented, extremely small domains of LiMn 2 O 4 -type spinel phase embedded within the amorphous surrounding resulting from the breakdown of the parent lattice of Li 2 MnO 3 upon cycling. Thus, there exist contradicting views about the structural modifi cations in Li 2 MnO 3 upon cycling. | |
| low | 9 | 137 | page_footer | page_footer | after_back_matter_stop | after_back_matter_stop | after_stop | p9:body_region:0 | p9:bottom_margin:column_1_of_2:white | [255, 255, 255] white | [51.06, 743.21, 104.16, 5.94] | Adv. Energy Mater . 2014 , 4 , 1300998 | Adv. Energy Mater . 2014 , 4 , 1300998 | |
| low | 9 | 138 | text | reference | after_back_matter_stop | after_back_matter_stop | after_stop | p9:top_margin:column_2_of_2:gray | [229, 229, 229] gray | [577.94, 15.66, 4.29, 743.12] | 16146840, 2014, 5, Downloaded from https://advanced.onlinelibrary.wiley.com/doi/10.1002/aenm.201300998 by Jilin University, Wiley Online Library on [11/07/2026]. See the Terms and Conditions (https://onlinelibrary.wiley.com/terms-and-conditions) on Wiley Online Library for rules of use; OA articles are governed by the applicable Creative Commons License | |||
| low | 9 | 139 | text | page_margin_header | after_back_matter_stop | after_back_matter_stop | after_stop | p9:body_region:1 | p9:top_margin:column_2_of_2:white | [255, 255, 255] white | [473.91, 45.23, 73.35, 6.78] | www.advenergymat.de | ||
| low | 9 | 140 | page_header | page_header | after_back_matter_stop | after_back_matter_stop | after_stop | p9:front_matter:front_panel:gray | [127, 129, 133] gray | [571.77, 70.54, 11.89, 80.75] | FULL PAPER | FULL PAPER | ||
| low | 9 | 145 | text | unknown_text | after_back_matter_stop | after_back_matter_stop | after_stop | p9:body_region:1 | p9:body_zone:column_2_of_2:white | [255, 255, 255] white | [537.03, 639.81, 12.31, 8.52] | (4) | (4) | |
| low | 9 | 147 | page_footer | page_footer | after_back_matter_stop | after_back_matter_stop | after_stop | p9:body_region:1 | p9:bottom_margin:column_2_of_2:white | [255, 255, 255] white | [494.77, 741.91, 67.86, 7.64] | (9 of 12) 1300998 | (9 of 12) 1300998 | |
| low | 9 | 148 | page_footer | page_footer | after_back_matter_stop | after_back_matter_stop | after_stop | p9:body_region:0 | p9:bottom_margin:column_2_of_2:white | [255, 255, 255] white | [185.77, 742.91, 169.97, 6.29] | © 2013 WILEY-VCH Verlag GmbH & Co. KGaA, Weinheim | © 2013 WILEY-VCH Verlag GmbH & Co. KGaA, Weinheim | |
| low | 9 | 149 | page_footer | page_footer | after_back_matter_stop | after_back_matter_stop | after_stop | p9:body_region:1 | p9:bottom_margin:column_2_of_2:white | [255, 255, 255] white | [388.05, 743.22, 64.38, 5.93] | wileyonlinelibrary.com | wileyonlinelibrary.com | |
| low | 10 | 150 | text | page_margin_header | after_back_matter_stop | after_back_matter_stop | after_stop | p10:body_region:0 | p10:top_margin:column_1_of_2:white | [255, 255, 255] white | [46.91, 45.16, 73.33, 6.78] | www.advenergymat.de | ||
| low | 10 | 151 | page_header | page_header | after_back_matter_stop | after_back_matter_stop | after_stop | p10:page_body:column_1_of_2:gray | [164, 165, 168] gray | [10.31, 70.11, 11.89, 80.75] | FULL PAPER | FULL PAPER | ||
| low | 10 | 153 | section_header | unknown_text | after_back_matter_stop | after_back_matter_stop | after_stop | p10:body_region:0 | p10:page_body:column_1_of_2:white | [255, 255, 255] white | [46.9, 305.37, 72.99, 9.74] | 4 . Conclusions | 4 . Conclusions | |
| low | 10 | 156 | page_footer | page_footer | after_back_matter_stop | after_back_matter_stop | after_stop | p10:body_region:0 | p10:bottom_margin:column_1_of_2:white | [255, 255, 255] white | [32.48, 741.91, 72.35, 7.64] | 1300998 (10 of 12) | 1300998 (10 of 12) | |
| low | 10 | 157 | page_footer | page_footer | after_back_matter_stop | after_back_matter_stop | after_stop | p10:body_region:0 | p10:bottom_margin:column_1_of_2:white | [255, 255, 255] white | [137.77, 743.22, 64.38, 5.93] | wileyonlinelibrary.com | wileyonlinelibrary.com | |
| low | 10 | 158 | page_header | page_header | after_back_matter_stop | after_back_matter_stop | after_stop | p10:top_margin:column_2_of_2:white | [253, 253, 253] white | [577.94, 15.66, 4.29, 743.12] | 16146840, 2014, 5, Downloaded from https://advanced.onlinelibrary.wiley.com/doi/10.1002/aenm.201300998 by Jilin University, Wiley Online Library on [11/07/2026]. See the Terms and Conditions (https://onlinelibrary.wiley.com/terms-and-conditions) on Wiley Online Library for rules of use; OA articles are governed by the applicable Creative Commons License | |||
| low | 10 | 159 | text | page_margin_header | after_back_matter_stop | after_back_matter_stop | after_stop | p10:body_region:1 | p10:top_margin:column_2_of_2:white | [255, 255, 255] white | [457.98, 53.43, 83.44, 6.78] | www.MaterialsViews.com | ||
| low | 10 | 160 | section_header | unknown_text | after_back_matter_stop | after_back_matter_stop | after_stop | p10:body_region:1 | p10:page_body:column_2_of_2:white | [255, 255, 255] white | [302.01, 72.16, 115.78, 9.74] | 5 . Experimental Section | 5 . Experimental Section | |
| low | 10 | 165 | page_footer | page_footer | after_back_matter_stop | after_back_matter_stop | after_stop | p10:body_region:1 | p10:bottom_margin:column_2_of_2:white | [255, 255, 255] white | [236.51, 742.89, 169.97, 6.29] | © 2013 WILEY-VCH Verlag GmbH & Co. KGaA, Weinheim | © 2013 WILEY-VCH Verlag GmbH & Co. KGaA, Weinheim | |
| low | 10 | 166 | page_footer | page_footer | after_back_matter_stop | after_back_matter_stop | after_stop | p10:body_region:1 | p10:bottom_margin:column_2_of_2:white | [255, 255, 255] white | [440.0, 743.21, 103.42, 5.94] | Adv. Energy Mater. 2014 , 4 , 1300998 | Adv. Energy Mater. 2014 , 4 , 1300998 | |
| low | 11 | 168 | text | page_margin_header | after_back_matter_stop | after_back_matter_stop | after_stop | p11:body_region:0 | p11:top_margin:left:white | [255, 255, 255] white | [51.01, 53.34, 83.44, 6.78] | www.MaterialsViews.com | ||
| low | 11 | 169 | list_item | reference | after_back_matter_stop | after_back_matter_stop | after_stop | p11:body_region:0 | p11:page_body:left:white | [255, 255, 255] white | [51.04, 651.9, 172.03, 6.79] | C. S. Johnson , J. Power Sources 2007 , 165 , 559 . | C. S. Johnson , J. Power Sources 2007 , 165 , 559 . | |
| low | 11 | 170 | section_header | back_matter_heading | after_back_matter_stop | after_back_matter_stop | after_stop | p11:body_region:0 | p11:page_body:left:white | [255, 255, 255] white | [51.04, 401.12, 115.6, 9.74] | Supporting Information | Supporting Information | |
| low | 11 | 171 | text | back_matter_heading | after_back_matter_stop | after_back_matter_stop | after_stop | p11:body_region:0 | p11:page_body:left_crossing:white | [255, 255, 255] white | [51.04, 418.9, 242.95, 16.29] | Supporting Information is available from the Wiley Online Library or from the author. | Supporting Information is available from the Wiley Online Library or from the author. | |
| low | 11 | 172 | section_header | back_matter_heading | after_back_matter_stop | after_back_matter_stop | after_stop | p11:body_region:0 | p11:page_body:left:white | [255, 255, 255] white | [51.04, 463.12, 95.82, 9.74] | Acknowledgements | Acknowledgements | |
| low | 11 | 173 | text | back_matter_text | after_back_matter_stop | after_back_matter_stop | after_stop | p11:body_region:0 | p11:page_body:left_crossing:white | [255, 255, 255] white | [51.04, 480.9, 242.95, 54.79] | The authors acknowledge fi nancial support from the Europäischer Fonds für regionale Entwicklung (EFRE) under the project BATMAT (No. 200720132/35). R.K. acknowledges fi nancial support from the Hans-L. Merkle Stiftung of the Robert Bosch GmbH. M.S. acknowledges fi nancial support from the German Ministry of Education and Research (BMBF) in the project STELLA (03X44620). | The authors acknowledge fi nancial support from the Europäischer Fonds für regionale Entwicklung (EFRE) under the project BATMAT (No. 200720132/35). R.K. acknowledges fi nancial support from the Hans-L. Merkle Stiftung of the Robert Bosch GmbH. M.S. acknowledges fi nancial support from the German Ministry of Education and Research (BMBF) in the project STELLA (03X44620). | |
| low | 11 | 174 | page_footer | page_footer | after_back_matter_stop | after_back_matter_stop | after_stop | p11:body_region:0 | p11:bottom_margin:left:white | [255, 255, 255] white | [51.06, 743.21, 104.16, 5.94] | Adv. Energy Mater . 2014 , 4 , 1300998 | Adv. Energy Mater . 2014 , 4 , 1300998 | |
| low | 11 | 175 | list_item | reference | after_back_matter_stop | after_back_matter_stop | after_stop | p11:body_region:0 | p11:page_body:left_crossing:white | [255, 255, 255] white | [55.34, 611.9, 238.65, 16.79] | C. S. Johnson , N. Li , J. T . Vaughey , S. A. Hackney , M. M. Thackeray , Electrochem. Commun. 2005 , 7 , 528 . | C. S. Johnson , N. Li , J. T . Vaughey , S. A. Hackney , M. M. Thackeray , Electrochem. Commun. 2005 , 7 , 528 . | |
| low | 11 | 176 | list_item | reference | after_back_matter_stop | after_back_matter_stop | after_stop | p11:body_region:0 | p11:page_body:left_crossing:white | [255, 255, 255] white | [55.34, 631.9, 238.65, 16.79] | M. M. Thackeray , S.-H. Kang , C. S. Johnson , J. T . Vaughey , S. A. Hackney , Electrochem. Commun. 2006 , 8 , 1531 . | M. M. Thackeray , S.-H. Kang , C. S. Johnson , J. T . Vaughey , S. A. Hackney , Electrochem. Commun. 2006 , 8 , 1531 . | |
| low | 11 | 177 | list_item | reference | after_back_matter_stop | after_back_matter_stop | after_stop | p11:body_region:0 | p11:page_body:left_crossing:white | [255, 255, 255] white | [55.34, 661.9, 238.65, 16.79] | C. S. Johnson , N. Li , C. Lefi ef , M. M. Thackeray , Electrochem. Commun. 2007 , 9 , 787 . | C. S. Johnson , N. Li , C. Lefi ef , M. M. Thackeray , Electrochem. Commun. 2007 , 9 , 787 . | |
| low | 11 | 178 | list_item | reference | after_back_matter_stop | after_back_matter_stop | after_stop | p11:body_region:0 | p11:page_body:left_crossing:white | [255, 255, 255] white | [55.34, 681.9, 238.65, 16.79] | M. M. Thackeray , S.-H. Kang , C. S. Johnson , J. T. Vaughey , R. Benedek , S. A. Hackney , J. Mater. Chem. 2007 , 17 , 3112 . | M. M. Thackeray , S.-H. Kang , C. S. Johnson , J. T. Vaughey , R. Benedek , S. A. Hackney , J. Mater. Chem. 2007 , 17 , 3112 . | |
| low | 11 | 179 | list_item | reference | after_back_matter_stop | after_back_matter_stop | after_stop | p11:body_region:0 | p11:page_body:left_crossing:white | [255, 255, 255] white | [55.34, 701.9, 238.65, 16.79] | J. Li , R. Klöpsch , M. C. Stan , S. Nowak , M. Kunze , M. Winter , S. Passerini , J. Power Sources 2011 , 196 , 4821 . | J. Li , R. Klöpsch , M. C. Stan , S. Nowak , M. Kunze , M. Winter , S. Passerini , J. Power Sources 2011 , 196 , 4821 . | |
| low | 11 | 180 | list_item | reference | after_back_matter_stop | after_back_matter_stop | after_stop | p11:body_region:0 | p11:page_body:left_crossing:white | [255, 255, 255] white | [55.35, 591.9, 238.63, 16.79] | C. S. Johnson , J.-S. Kim , C. Lefi ef , N. Li , J. T . Vaughey , M. M. Thackeray , Electrochem. Commun. 2004 , 6 , 1085 . | C. S. Johnson , J.-S. Kim , C. Lefi ef , N. Li , J. T . Vaughey , M. M. Thackeray , Electrochem. Commun. 2004 , 6 , 1085 . | |
| low | 11 | 181 | text | reference | after_back_matter_stop | after_back_matter_stop | after_stop | p11:body_region:0 | p11:page_body:left_crossing:white | [255, 255, 255] white | [167.56, 547.9, 126.43, 26.79] | Received: August 7, 2013 Revised: October 17, 2013 Published online: December 27, 2013 | Received: August 7, 2013 Revised: October 17, 2013 Published online: December 27, 2013 | |
| low | 11 | 182 | page_footer | page_footer | after_back_matter_stop | after_back_matter_stop | after_stop | p11:body_region:0 | p11:bottom_margin:left_crossing:white | [255, 255, 255] white | [185.77, 742.91, 169.97, 6.29] | © 2013 WILEY-VCH Verlag GmbH & Co. KGaA, Weinheim | © 2013 WILEY-VCH Verlag GmbH & Co. KGaA, Weinheim | |
| low | 11 | 183 | list_item | reference | after_back_matter_stop | after_back_matter_stop | after_stop | p11:page_body:right_crossing:white | [255, 255, 255] white | [306.14, 451.92, 242.95, 16.79] | D. Marabello , R. Bianchi , G. Gervasio , F. Cargnoni , Acta Crystallogr., Sect. A: Found. Crystallogr. 2004 , A60 , 494 . | D. Marabello , R. Bianchi , G. Gervasio , F. Cargnoni , Acta Crystallogr., Sect. A: Found. Crystallogr. 2004 , A60 , 494 . | ||
| low | 11 | 184 | list_item | reference | after_back_matter_stop | after_back_matter_stop | after_stop | p11:page_body:right_crossing:white | [255, 255, 255] white | [306.14, 471.92, 242.94, 16.79] | A. Ito , Y. Sato , T . Sanada , M. Hatano , H. Horie , Y . Ohsawa , J. Power Sources 2011 , 196 , 6828 . | A. Ito , Y. Sato , T . Sanada , M. Hatano , H. Horie , Y . Ohsawa , J. Power Sources 2011 , 196 , 6828 . | ||
| low | 11 | 185 | list_item | reference | after_back_matter_stop | after_back_matter_stop | after_stop | p11:page_body:right_crossing:white | [255, 255, 255] white | [306.14, 491.92, 226.86, 6.79] | V. B. Sapre , C. Mande , J. Phys. C: Solid State Phys. 1972 , 5 , 793 . | V. B. Sapre , C. Mande , J. Phys. C: Solid State Phys. 1972 , 5 , 793 . | ||
| low | 11 | 186 | list_item | reference | after_back_matter_stop | after_back_matter_stop | after_stop | p11:page_body:right_crossing:white | [255, 255, 255] white | [306.15, 441.92, 166.39, 6.79] | W. H. Baur , Acta Crystallogr. 1976 , B32 , 2200 . | W. H. Baur , Acta Crystallogr. 1976 , B32 , 2200 . | ||
| low | 11 | 187 | list_item | reference | after_back_matter_stop | after_back_matter_stop | after_stop | p11:page_body:right_crossing:white | [255, 255, 255] white | [306.15, 391.92, 242.94, 16.79] | A. Deb , U. Bergmann , E. J. Cairns , S. P. Cramer , J. Synchrotron Radiat. 2004 , 11 , 497 . | A. Deb , U. Bergmann , E. J. Cairns , S. P. Cramer , J. Synchrotron Radiat. 2004 , 11 , 497 . | ||
| low | 11 | 188 | list_item | reference | after_back_matter_stop | after_back_matter_stop | after_stop | p11:page_body:right_crossing:white | [255, 255, 255] white | [306.15, 411.92, 242.94, 16.79] | S. Geller , J. A. Cape , R. W . Grant , G. P. Espinosa , Phys. Lett. A 1967 , 24A , 369 . | S. Geller , J. A. Cape , R. W . Grant , G. P. Espinosa , Phys. Lett. A 1967 , 24A , 369 . | ||
| low | 11 | 189 | list_item | reference | after_back_matter_stop | after_back_matter_stop | after_stop | p11:page_body:right_crossing:white | [255, 255, 255] white | [306.15, 381.92, 192.4, 6.79] | J. J. Rehr , R. C. Albers , Rev. Mod. Phys. 2000 , 72 , 621 . | J. J. Rehr , R. C. Albers , Rev. Mod. Phys. 2000 , 72 , 621 . | ||
| low | 11 | 190 | list_item | reference | after_back_matter_stop | after_back_matter_stop | after_stop | p11:page_body:right_crossing:white | [255, 255, 255] white | [306.15, 241.92, 240.94, 16.79] | D. Y. W. Yu , K. Y anagida , Y . Kato , H. Nakamura , J. Electrochem. Soc. 2009 , 156 , A417 . | D. Y. W. Yu , K. Y anagida , Y . Kato , H. Nakamura , J. Electrochem. Soc. 2009 , 156 , A417 . | ||
| low | 11 | 191 | list_item | reference | after_back_matter_stop | after_back_matter_stop | after_stop | p11:page_body:right_crossing:white | [255, 255, 255] white | [306.15, 311.92, 231.24, 6.79] | P. Strobel , B. Lambert-Andron , J. Solid State Chem. 1988 , 75 , 90 . | P. Strobel , B. Lambert-Andron , J. Solid State Chem. 1988 , 75 , 90 . | ||
| low | 11 | 192 | list_item | reference | after_back_matter_stop | after_back_matter_stop | after_stop | p11:page_body:right_crossing:white | [255, 255, 255] white | [306.15, 331.92, 242.95, 16.79] | M. H. Rossouw , D. C. Liles , M. M. Thackeray , W . I. F. David , S. Hull , Mater. Res. Bull. 1992 , 27 , 221 . | M. H. Rossouw , D. C. Liles , M. M. Thackeray , W . I. F. David , S. Hull , Mater. Res. Bull. 1992 , 27 , 221 . | ||
| low | 11 | 193 | list_item | reference | after_back_matter_stop | after_back_matter_stop | after_stop | p11:page_body:right_crossing:white | [255, 255, 255] white | [306.15, 351.92, 242.94, 16.79] | Y. Paik , C. P. Grey , C. S. Johnson , J.-S. Kim , M. M. Thackeray , Chem. Mater. 2002 , 14 , 5109 . | Y. Paik , C. P. Grey , C. S. Johnson , J.-S. Kim , M. M. Thackeray , Chem. Mater. 2002 , 14 , 5109 . | ||
| low | 11 | 194 | list_item | reference | after_back_matter_stop | after_back_matter_stop | after_stop | p11:page_body:right_crossing:white | [255, 255, 255] white | [306.15, 371.92, 239.87, 6.79] | D. E. Sayers , E. A. Stern , F. W . Lytle , Phys. Rev. Lett. 1971 , 27 , 1204 . | D. E. Sayers , E. A. Stern , F. W . Lytle , Phys. Rev. Lett. 1971 , 27 , 1204 . | ||
| low | 11 | 195 | list_item | reference | after_back_matter_stop | after_back_matter_stop | after_stop | p11:page_body:right_crossing:white | [255, 255, 255] white | [306.15, 431.92, 236.46, 6.79] | C. Y. Ouyang , S. Q. Shi , M. S. Lei , J. Alloys Compd. 2009 , 474 , 370 . | C. Y. Ouyang , S. Q. Shi , M. S. Lei , J. Alloys Compd. 2009 , 474 , 370 . | ||
| low | 11 | 196 | list_item | reference | after_back_matter_stop | after_back_matter_stop | after_stop | p11:page_body:right_crossing:white | [255, 255, 255] white | [306.15, 261.92, 224.95, 6.79] | D. Y. W. Yu , K. Y anagida , J. Electrochem. Soc. 2011 , 158 , A1015 . | D. Y. W. Yu , K. Y anagida , J. Electrochem. Soc. 2011 , 158 , A1015 . | ||
| low | 11 | 197 | list_item | reference | after_back_matter_stop | after_back_matter_stop | after_stop | p11:page_body:right_crossing:white | [255, 255, 255] white | [306.15, 701.92, 242.94, 16.79] | A. R. Armstrong , A. J. Paterson , A. D. Robertson , P. G. Bruce , Chem. Mater. 2002 , 14 , 710 . | A. R. Armstrong , A. J. Paterson , A. D. Robertson , P. G. Bruce , Chem. Mater. 2002 , 14 , 710 . | ||
| low | 11 | 198 | list_item | reference | after_back_matter_stop | after_back_matter_stop | after_stop | p11:page_body:right_crossing:white | [255, 255, 255] white | [306.15, 501.92, 242.95, 16.79] | W. Tang , H. Kanoh , X. Y ang , K. Ooi , Chem. Mater. 2000 , 12 , 3271 . | W. Tang , H. Kanoh , X. Y ang , K. Ooi , Chem. Mater. 2000 , 12 , 3271 . | ||
| low | 11 | 199 | list_item | reference | after_back_matter_stop | after_back_matter_stop | after_stop | p11:page_body:right_crossing:white | [255, 255, 255] white | [306.15, 601.92, 177.91, 6.79] | K. Kanamura , J. Power Sources 1999 , 81-82 , 123 . | K. Kanamura , J. Power Sources 1999 , 81-82 , 123 . | ||
| low | 11 | 200 | list_item | reference | after_back_matter_stop | after_back_matter_stop | after_stop | p11:page_body:right_crossing:white | [255, 255, 255] white | [306.15, 611.92, 240.95, 16.79] | M. Moshkovich , M. Cojocaru , H. E. Gottlieb , D. Aurbach , J. Electroanal. Chem. 2001 , 497 , 84 . | M. Moshkovich , M. Cojocaru , H. E. Gottlieb , D. Aurbach , J. Electroanal. Chem. 2001 , 497 , 84 . | ||
| low | 11 | 201 | list_item | reference | after_back_matter_stop | after_back_matter_stop | after_stop | p11:page_body:right_crossing:white | [255, 255, 255] white | [306.15, 641.92, 242.95, 16.79] | B. Ammundsen , P. B. Aitchison , G. R. Burns , D. J. Jones , J. Rozière , Solid State Ionics 1997 , 97 , 269 . | B. Ammundsen , P. B. Aitchison , G. R. Burns , D. J. Jones , J. Rozière , Solid State Ionics 1997 , 97 , 269 . | ||
| low | 11 | 202 | list_item | reference | after_back_matter_stop | after_back_matter_stop | after_stop | p11:page_body:right_crossing:white | [255, 255, 255] white | [306.15, 661.92, 240.94, 16.79] | M. H. Rossouw , D. C. Liles , M. M. Thackeray , J. Solid State Chem. 1993 , 104 , 464 . | M. H. Rossouw , D. C. Liles , M. M. Thackeray , J. Solid State Chem. 1993 , 104 , 464 . | ||
| low | 11 | 203 | list_item | reference | after_back_matter_stop | after_back_matter_stop | after_stop | p11:page_body:right_crossing:white | [255, 255, 255] white | [306.15, 681.92, 242.94, 16.79] | A. D. Robertson , A. R. Armstrong , P. G. Bruce , Chem. Mater. 2001 , 13 , 2380 . | A. D. Robertson , A. R. Armstrong , P. G. Bruce , Chem. Mater. 2001 , 13 , 2380 . | ||
| low | 11 | 204 | list_item | reference | after_back_matter_stop | after_back_matter_stop | after_stop | p11:page_body:right_crossing:white | [255, 255, 255] white | [306.15, 631.92, 218.87, 6.79] | Q. Feng , Y . Miyai , H. Kanoh , K. Ooi , Langmuir 1992 , 8 , 1861 . | Q. Feng , Y . Miyai , H. Kanoh , K. Ooi , Langmuir 1992 , 8 , 1861 . | ||
| low | 11 | 205 | list_item | reference | after_back_matter_stop | after_back_matter_stop | after_stop | p11:page_body:right_crossing:white | [255, 255, 255] white | [306.15, 111.92, 240.95, 16.79] | A. Boulineau , L. Croguennec , C. Delmas , F. Weill , Solid State Ionics 2010 , 180 , 1652 . | A. Boulineau , L. Croguennec , C. Delmas , F. Weill , Solid State Ionics 2010 , 180 , 1652 . | ||
| low | 11 | 206 | list_item | reference | after_back_matter_stop | after_back_matter_stop | after_stop | p11:page_body:right_crossing:white | [255, 255, 255] white | [306.15, 131.92, 194.09, 6.79] | M. M. Thackeray , Prog. Solid State Chem. 1997 , 25 , 1 . | M. M. Thackeray , Prog. Solid State Chem. 1997 , 25 , 1 . | ||
| low | 11 | 207 | list_item | reference | after_back_matter_stop | after_back_matter_stop | after_stop | p11:page_body:right_crossing:white | [255, 255, 255] white | [306.15, 171.92, 213.89, 6.79] | A. D. Robertson , P. G. Bruce , Chem. Mater. 2003 , 15 , 1984 . | A. D. Robertson , P. G. Bruce , Chem. Mater. 2003 , 15 , 1984 . | ||
| low | 11 | 208 | list_item | reference | after_back_matter_stop | after_back_matter_stop | after_stop | p11:page_body:right_crossing:white | [255, 255, 255] white | [306.15, 181.92, 240.94, 16.79] | A. R. Armstrong , A. D. Robertson , P. G. Bruce , J. Power Sources 2005 , 146 , 275 . | A. R. Armstrong , A. D. Robertson , P. G. Bruce , J. Power Sources 2005 , 146 , 275 . | ||
| low | 11 | 209 | list_item | reference | after_back_matter_stop | after_back_matter_stop | after_stop | p11:page_body:right_crossing:white | [255, 255, 255] white | [306.15, 201.92, 242.94, 16.79] | G. Jain , J. Yang , M. Balasubramanian , J. J. Xu , Chem. Mater. 2005 , 17 , 3850 . | G. Jain , J. Yang , M. Balasubramanian , J. J. Xu , Chem. Mater. 2005 , 17 , 3850 . | ||
| low | 11 | 210 | list_item | reference | after_back_matter_stop | after_back_matter_stop | after_stop | p11:page_body:right_crossing:white | [255, 255, 255] white | [306.15, 221.92, 242.94, 16.79] | D. Pasero , V . McLaren , S. de Souza , A. R. West , Chem. Mater. 2005 , 17 , 345 . | D. Pasero , V . McLaren , S. de Souza , A. R. West , Chem. Mater. 2005 , 17 , 345 . | ||
| low | 11 | 211 | list_item | reference | after_back_matter_stop | after_back_matter_stop | after_stop | p11:page_body:right_crossing:white | [255, 255, 255] white | [306.15, 321.92, 233.68, 6.79] | M. H. Rossouw , M. M. Thackeray , Mater. Res. Bull. 1991 , 26 , 463 . | M. H. Rossouw , M. M. Thackeray , Mater. Res. Bull. 1991 , 26 , 463 . | ||
| low | 11 | 212 | list_item | reference | after_back_matter_stop | after_back_matter_stop | after_stop | p11:page_body:right_crossing:white | [255, 255, 255] white | [306.15, 271.92, 240.94, 16.79] | J. Wong , F. W . Lytle , R. P. Messmer , D. H. Maylotte , Phys. Rev. B 1984 , 30 , 5596 . | J. Wong , F. W . Lytle , R. P. Messmer , D. H. Maylotte , Phys. Rev. B 1984 , 30 , 5596 . | ||
| low | 11 | 213 | list_item | reference | after_back_matter_stop | after_back_matter_stop | after_stop | p11:page_body:right_crossing:white | [255, 255, 255] white | [306.15, 291.92, 242.94, 16.79] | O. Haas , A. Deb , E. J. Cairns , A. Wokaun , J. Electrochem. Soc. 2005 , 152 , A191 . | O. Haas , A. Deb , E. J. Cairns , A. Wokaun , J. Electrochem. Soc. 2005 , 152 , A191 . | ||
| low | 11 | 214 | list_item | reference | after_back_matter_stop | after_back_matter_stop | after_stop | p11:page_body:right_crossing:white | [255, 255, 255] white | [306.15, 521.92, 199.17, 6.79] | J. B. Goodenough , Y . Kim , Chem. Mater. 2010 , 22 , 587 . | J. B. Goodenough , Y . Kim , Chem. Mater. 2010 , 22 , 587 . | ||
| low | 11 | 215 | list_item | reference | after_back_matter_stop | after_back_matter_stop | after_stop | p11:page_body:right_crossing:white | [255, 255, 255] white | [306.15, 531.92, 242.95, 16.79] | H. Koga , L. Croguennec , M. Ménétrier , P. Mannessiez , F. Weill , C. Delmas , J. Power Sources 2013 , 236 , 250 . | H. Koga , L. Croguennec , M. Ménétrier , P. Mannessiez , F. Weill , C. Delmas , J. Power Sources 2013 , 236 , 250 . | ||
| low | 11 | 216 | list_item | reference | after_back_matter_stop | after_back_matter_stop | after_stop | p11:page_body:right_crossing:white | [255, 255, 255] white | [306.15, 551.92, 242.95, 26.79] | H. Koga , L. Croguennec , M. Ménétrier , K. Douhil , S. Belin , L. Bourgeois , E. Suard , F. Weill , C. Delmas , J. Electrochem. Soc. 2013 , 160 , A786 . | H. Koga , L. Croguennec , M. Ménétrier , K. Douhil , S. Belin , L. Bourgeois , E. Suard , F. Weill , C. Delmas , J. Electrochem. Soc. 2013 , 160 , A786 . | ||
| low | 11 | 217 | list_item | reference | after_back_matter_stop | after_back_matter_stop | after_stop | p11:page_body:right_crossing:white | [255, 255, 255] white | [306.15, 581.92, 240.94, 16.79] | K. Kanamura , S. T oriyama , S. Shiraishi , Z.-i. T akehara , J. Electrochem. Soc. 1996 , 143 , 2548 . | K. Kanamura , S. T oriyama , S. Shiraishi , Z.-i. T akehara , J. Electrochem. Soc. 1996 , 143 , 2548 . | ||
| low | 11 | 218 | list_item | reference | after_back_matter_stop | after_back_matter_stop | after_stop | p11:page_body:right_crossing:white | [255, 255, 255] white | [306.15, 141.92, 240.95, 16.79] | P. Kalyani , S. Chitra , T . Mohan , S. Gopukumar , J. Power Sources 1999 , 80 , 103 . | P. Kalyani , S. Chitra , T . Mohan , S. Gopukumar , J. Power Sources 1999 , 80 , 103 . | ||
| low | 11 | 219 | list_item | reference | after_back_matter_stop | after_back_matter_stop | after_stop | p11:page_body:right_crossing:white | [255, 255, 255] white | [306.15, 161.92, 212.52, 6.79] | A. D. Robertson , P. G. Bruce , Chem. Commun. 2002 , 2790 . | A. D. Robertson , P. G. Bruce , Chem. Commun. 2002 , 2790 . | ||
| low | 11 | 220 | list_item | reference | after_back_matter_stop | after_back_matter_stop | after_stop | p11:page_body:right:white | [255, 255, 255] white | [310.45, 91.92, 238.65, 16.79] | J. R. Croy , D. Kim , M. Balasubramanian , K. Gallagher , S.-H. Kang , M. M. Thackeray , J. Electrochem. Soc. 2012 , 159 , A781 . | J. R. Croy , D. Kim , M. Balasubramanian , K. Gallagher , S.-H. Kang , M. M. Thackeray , J. Electrochem. Soc. 2012 , 159 , A781 . | ||
| low | 11 | 221 | list_item | reference | after_back_matter_stop | after_back_matter_stop | after_stop | p11:page_body:right:white | [255, 255, 255] white | [310.45, 71.92, 238.64, 16.79] | J. R. Croy , M. Balasubramanian , D. Kim , S.-H. Kang , M. M. Thackeray , Chem. Mater. 2011 , 23 , 5415 . | J. R. Croy , M. Balasubramanian , D. Kim , S.-H. Kang , M. M. Thackeray , Chem. Mater. 2011 , 23 , 5415 . | ||
| low | 11 | 222 | page_footer | page_footer | after_back_matter_stop | after_back_matter_stop | after_stop | p11:bottom_margin:right:white | [255, 255, 255] white | [388.05, 743.22, 64.38, 5.93] | wileyonlinelibrary.com | wileyonlinelibrary.com | ||
| low | 11 | 223 | text | page_margin_header | after_back_matter_stop | after_back_matter_stop | after_stop | p11:top_margin:right:white | [255, 255, 255] white | [473.91, 45.23, 73.35, 6.78] | www.advenergymat.de | |||
| low | 11 | 224 | page_footer | page_footer | after_back_matter_stop | after_back_matter_stop | after_stop | p11:bottom_margin:right:white | [255, 255, 255] white | [490.29, 741.91, 72.34, 7.64] | (11 of 12) 1300998 | (11 of 12) 1300998 | ||
| low | 11 | 225 | page_header | page_header | after_back_matter_stop | after_back_matter_stop | after_stop | p11:page_body:right:gray | [127, 129, 133] gray | [571.77, 70.54, 11.89, 80.75] | FULL PAPER | FULL PAPER | ||
| low | 11 | 226 | page_header | page_header | after_back_matter_stop | after_back_matter_stop | after_stop | p11:top_margin:right:gray | [229, 229, 229] gray | [577.94, 15.66, 4.29, 743.12] | 16146840, 2014, 5, Downloaded from https://advanced.onlinelibrary.wiley.com/doi/10.1002/aenm.201300998 by Jilin University, Wiley Online Library on [11/07/2026]. See the Terms and Conditions (https://onlinelibrary.wiley.com/terms-and-conditions) on Wiley Online Library for rules of use; OA articles are governed by the applicable Creative Commons License | |||
| low | 12 | 227 | page_header | page_header | after_back_matter_stop | after_back_matter_stop | after_stop | p12:page_body:left:gray | [164, 165, 168] gray | [10.31, 70.11, 11.89, 80.75] | FULL PAPER | FULL PAPER | ||
| low | 12 | 228 | page_footer | page_footer | after_back_matter_stop | after_back_matter_stop | after_stop | p12:bottom_margin:left:white | [255, 255, 255] white | [32.48, 741.91, 72.35, 7.64] | 1300998 (12 of 12) | 1300998 (12 of 12) | ||
| low | 12 | 229 | section_header | metadata | after_back_matter_stop | after_back_matter_stop | after_stop | p12:top_margin:left:white | [255, 255, 255] white | [46.91, 45.16, 73.33, 6.78] | www.advenergymat.de | |||
| low | 12 | 230 | list_item | reference | after_back_matter_stop | after_back_matter_stop | after_stop | p12:page_body:left_crossing:white | [255, 255, 255] white | [46.95, 71.9, 242.95, 26.79] | M. Gu , I. Belharouak , J. Zheng , H. Wu , J. Xiao , A. Genc , K. Amine , S. Thevuthasan , D. R. Baer , J.-G. Zhang , N. D. Browning , J. Liu , C. Wang , ACS Nano 2012 , 7 , 760 . | M. Gu , I. Belharouak , J. Zheng , H. Wu , J. Xiao , A. Genc , K. Amine , S. Thevuthasan , D. R. Baer , J.-G. Zhang , N. D. Browning , J. Liu , C. Wang , ACS Nano 2012 , 7 , 760 . | ||
| low | 12 | 231 | list_item | reference | after_back_matter_stop | after_back_matter_stop | after_stop | p12:page_body:left_crossing:white | [255, 255, 255] white | [46.95, 131.9, 240.94, 16.79] | W. Liu , G. C. Farrington , F. Chaput , B. Dunn , J. Electrochem. Soc. 1996 , 143 , 879 . | W. Liu , G. C. Farrington , F. Chaput , B. Dunn , J. Electrochem. Soc. 1996 , 143 , 879 . | ||
| low | 12 | 232 | list_item | reference | after_back_matter_stop | after_back_matter_stop | after_stop | p12:page_body:left_crossing:white | [255, 255, 255] white | [46.95, 151.9, 242.94, 26.79] | S. D. Kelly , D. Hesterberg , B. Ravel , Methods of Soil Analysis, Part 5-Mineralogical Methods, Soil Science Society of America, Madison, WI, USA 2008 , p. 387 . | S. D. Kelly , D. Hesterberg , B. Ravel , Methods of Soil Analysis, Part 5-Mineralogical Methods, Soil Science Society of America, Madison, WI, USA 2008 , p. 387 . | ||
| low | 12 | 233 | list_item | reference | after_back_matter_stop | after_back_matter_stop | after_stop | p12:page_body:left:white | [255, 255, 255] white | [46.95, 181.9, 211.13, 6.79] | B. Ravel , M. Newville , J. Synchrotron Radiat. 2005 , 12 , 537 . | B. Ravel , M. Newville , J. Synchrotron Radiat. 2005 , 12 , 537 . | ||
| low | 12 | 234 | list_item | reference | after_back_matter_stop | after_back_matter_stop | after_stop | p12:page_body:left_crossing:white | [255, 255, 255] white | [46.95, 101.9, 242.95, 26.79] | Y. Shao-Horn , S. A. Hackney , A. R. Armstrong , P. G. Bruce , R. Gitzendanner , C. S. Johnson , M. M. Thackeray , J. Electrochem. Soc. 1999 , 146 , 2404 . | Y. Shao-Horn , S. A. Hackney , A. R. Armstrong , P. G. Bruce , R. Gitzendanner , C. S. Johnson , M. M. Thackeray , J. Electrochem. Soc. 1999 , 146 , 2404 . | ||
| low | 12 | 235 | page_footer | page_footer | after_back_matter_stop | after_back_matter_stop | after_stop | p12:bottom_margin:left:white | [255, 255, 255] white | [137.77, 743.22, 64.38, 5.93] | wileyonlinelibrary.com | wileyonlinelibrary.com | ||
| low | 12 | 236 | page_footer | page_footer | after_back_matter_stop | after_back_matter_stop | after_stop | p12:bottom_margin:right_crossing:white | [255, 255, 255] white | [236.51, 742.89, 169.97, 6.29] | © 2013 WILEY-VCH Verlag GmbH & Co. KGaA, Weinheim | © 2013 WILEY-VCH Verlag GmbH & Co. KGaA, Weinheim | ||
| low | 12 | 237 | list_item | reference | after_back_matter_stop | after_back_matter_stop | after_stop | p12:page_body:right_crossing:white | [255, 255, 255] white | [302.06, 161.96, 210.98, 6.79] | B. D. Ravel , Ph.D. Thesis, University of Washington , 1997 . | B. D. Ravel , Ph.D. Thesis, University of Washington , 1997 . | ||
| low | 12 | 238 | list_item | reference | after_back_matter_stop | after_back_matter_stop | after_stop | p12:page_body:right_crossing:white | [255, 255, 255] white | [302.06, 171.96, 240.95, 16.79] | A. N. Christensen , P. Hansen , M. S. Lehmann , J. Solid State Chem. 1977 , 21 , 325 . | A. N. Christensen , P. Hansen , M. S. Lehmann , J. Solid State Chem. 1977 , 21 , 325 . | ||
| low | 12 | 239 | list_item | reference | after_back_matter_stop | after_back_matter_stop | after_stop | p12:page_body:right_crossing:white | [255, 255, 255] white | [302.06, 141.96, 224.55, 6.79] | S. Calvin , Ph.D. Thesis, The City University of New York , 2001 . | S. Calvin , Ph.D. Thesis, The City University of New York , 2001 . | ||
| low | 12 | 240 | list_item | reference | after_back_matter_stop | after_back_matter_stop | after_stop | p12:page_body:right_crossing:white | [255, 255, 255] white | [302.06, 151.96, 223.83, 6.79] | M. G. Newville , Ph.D. Thesis, University of Washington , 1995 . | M. G. Newville , Ph.D. Thesis, University of Washington , 1995 . | ||
| low | 12 | 241 | list_item | reference | after_back_matter_stop | after_back_matter_stop | after_stop | p12:page_body:right_crossing:white | [255, 255, 255] white | [302.06, 71.96, 240.94, 16.79] | A. L. Ankudinov , B. Ravel , J. J. Rehr , S. D. Conradson , Phys. Rev. B 1998 , 58 , 7565 . | A. L. Ankudinov , B. Ravel , J. J. Rehr , S. D. Conradson , Phys. Rev. B 1998 , 58 , 7565 . | ||
| low | 12 | 242 | list_item | reference | after_back_matter_stop | after_back_matter_stop | after_stop | p12:page_body:right_crossing:white | [255, 255, 255] white | [302.06, 91.96, 242.95, 16.79] | J. J. Rehr , E. A. Stern , R. L. Martin , E. R. Davidson , Phys. Rev. B 1978 , 17 , 560 . | J. J. Rehr , E. A. Stern , R. L. Martin , E. R. Davidson , Phys. Rev. B 1978 , 17 , 560 . | ||
| low | 12 | 243 | list_item | reference | after_back_matter_stop | after_back_matter_stop | after_stop | p12:page_body:right_crossing:white | [255, 255, 255] white | [302.06, 111.96, 237.18, 6.79] | E. A. Stern , B. A. Bunker , S. M. Heald , Phys. Rev. B 1980 , 21 , 5521 . | E. A. Stern , B. A. Bunker , S. M. Heald , Phys. Rev. B 1980 , 21 , 5521 . | ||
| low | 12 | 244 | list_item | reference | after_back_matter_stop | after_back_matter_stop | after_stop | p12:page_body:right_crossing:white | [255, 255, 255] white | [302.06, 121.96, 242.95, 16.79] | B. K. Teo , EXAFS: Basic Principles and Data Analysis , Springer-Verlag , Berlin 1986 . | B. K. Teo , EXAFS: Basic Principles and Data Analysis , Springer-Verlag , Berlin 1986 . | ||
| low | 12 | 245 | page_footer | page_footer | after_back_matter_stop | after_back_matter_stop | after_stop | p12:bottom_margin:right:white | [255, 255, 255] white | [440.0, 743.21, 103.42, 5.94] | Adv. Energy Mater. 2014 , 4 , 1300998 | Adv. Energy Mater. 2014 , 4 , 1300998 | ||
| low | 12 | 246 | text | page_margin_header | after_back_matter_stop | after_back_matter_stop | after_stop | p12:top_margin:right:white | [255, 255, 255] white | [457.98, 53.43, 83.44, 6.78] | www.MaterialsViews.com | |||
| low | 12 | 247 | page_header | page_header | after_back_matter_stop | after_back_matter_stop | after_stop | p12:top_margin:right:white | [253, 253, 253] white | [577.94, 15.66, 4.29, 743.12] | 16146840, 2014, 5, Downloaded from https://advanced.onlinelibrary.wiley.com/doi/10.1002/aenm.201300998 by Jilin University, Wiley Online Library on [11/07/2026]. See the Terms and Conditions (https://onlinelibrary.wiley.com/terms-and-conditions) on Wiley Online Library for rules of use; OA articles are governed by the applicable Creative Commons License |