H
1
2
3
4
original.pdf layout_review.html excluded_blocks.html final_body_blocks.tsv layout_blocks.tsv
绿色编号 = 最终进入正文的段落顺序;蓝色虚线 = section heading 边界。每个条目同时显示 Docling 页内原序、新页内顺序和识别栏位;排序只在同页内调整,不拆分文本块。
| # | page | Docling 页内原序 | 新页内顺序 | global layout order | zone | column | region | bbox | text |
|---|---|---|---|---|---|---|---|---|---|
| 1 | 1 | 16 | 11 | 10 | body_zone | column_2_of_2 | p1:body_region:1 | [306.14, 438.88, 240.62, 21.07] | transition from layered to spinel, which cause voltage drop, capacity loss, and higher impedance over time [4-6]. |
| 2 | 1 | 11 | 12 | 11 | body_zone | column_1_of_2 | p1:body_region:0 | [51.02, 463.88, 240.62, 121.07] | Lithium- and manganese-rich layered oxides, especially the compound Li₁.₂Mn₀.₅₄Ni₀.₁₃Co₀.₁₃O₂ (LMNCO), have become promising cathode materials for next-generation lithium-ion batteries (LIBs) due to their high specific capacity (> 250 mAh/g) and energy density (> 900 Wh/kg) originating from combined redox activity of transition metals and lattice oxygen at high voltages (> 4.5 V) [ 1-3]. This high energy performance, on the other hand, is often accom -panied by some irreversible structural degradation, such as oxygen loss, cation migration, and phase changes like the |
| 3 | 1 | 17 | 17 | 16 | body_zone | column_2_of_2 | p1:body_region:1 | [306.14, 463.88, 240.63, 183.57] | Researchers have focused on two main strategies to deal with these problems, including bulk doping to stabilize the crystal structure and speed up the movement of lithium ions and surface modification to improve interfacial stability and reduce side reactions. Tin (Sn) and indium (In) are two dopants which have received considerable attention because they change the electrochemical performance of cathode materials in interesting ways [7-9 ]. For example, Sn⁴⁺ doping has been shown to make the lattice structure bigger by replacing manganes ions (Mn⁴⁺), making it easier for lithium ions to move around and lowers structural stress. Zhou et al. showed that presence of even a small amount of Sn (1 mol%) in Li-rich cathodes could make a big difference in the initial discharge capacity (~ 269 mAh/g) and cycling stability [10]. |
| 4 | 1 | 18 | 18 | 17 | body_zone | column_2_of_2 | p1:body_region:1 | [306.14, 651.38, 240.62, 58.57] | Co-doping strategies using Sn and alkali metals like potassium (K) have also been shown to improve rate capabilities and lower charge transfer resistance by making lithium pathways wider and stabilizing interfaces [11]. Also, surface coatings made of Sn-based compounds like SnO₂ |
| 5 | 2 | 2 | 1 | 18 | front_matter | column_1_of_2 | p2:body_region:0 | [51.02, 63.88, 240.61, 33.57] | and Li₂SnO₃ have successfully been used to prevent oxygen formation during the initial cycles, which subsequently keep the Coulombic efficiency high [ 12, 13]. |
| 6 | 2 | 3 | 2 | 19 | front_matter | column_1_of_2 | p2:body_region:0 | [51.02, 101.38, 240.62, 108.57] | Previous studies revealed that doping other types of LIBs cathodes like LiFePO₄ with In or Sn dopants could result in significant improvements in their electronic conductivity and rate performance [14, 15]. Hence, this study aims to investigate the effect of the abovementioned dopants on structure and electrochemical performance of lithium-rich layered cathodes. In this regard, three types of LMNCO cathodes, including undoped (pristine), Sn-doped, and Indoped are initially synthesized. |
| 7 | 2 | 4 | 3 | 20 | front_matter | column_1_of_2 | p2:body_region:0 | [51.02, 213.88, 240.63, 146.07] | Then, they are structurally examined using different characterization tests. The X-ray diffraction (XRD) spectroscopy and Rietveld refinement are adopted to determine the crystal structure and lattice expansion. Field emission scanning electron microscopy (FESEM), Fourier transform infrared spectroscopy (FTIR), energy-dispersive X-ray spectroscopy (EDXS), and Raman spectroscopy are employed to scrutinize morphology and composition of fabricated cathodes. Finally, galvanostatic charge-discharge measurements, cyclic voltammetry (CV), and electrochemical impedance spectroscopy (EIS) are carried out to study electrochemical behavior of cathodes. |
| 8 | 2 | 7 | 6 | 23 | body_zone | column_1_of_2 | p2:body_region:0 | [51.02, 438.88, 240.63, 108.57] | High-purity metal salts were employed for the synthesis of the target nanopowders, consisting of nickel nitrate hexahydrate (Ni(NO₃)₂·6 H₂O), cobalt nitrate hexahydrate (Co(NO₃)₂·6 H₂O), manganese nitrate tetrahydrate (Mn(NO₃)₂·4 H₂O), lithium nitrate (LiNO₃), and tin nitrate (Sn(NO₃)₂). Citric acid monohydrate (C₆H₈O₇·H₂O) was added as a chelating agent to stabilize metal ions and facili -tate gel formation. All chemicals were used as-received without further purification. |
| 9 | 2 | 10 | 9 | 26 | body_zone | column_1_of_2 | p2:body_region:0 | [51.02, 613.88, 240.62, 96.07] | The pure nanopowder was synthesized using sol-gel method. In this regard, stoichiometric quantities of metal salts, including 1.298 g Ni(NO₃)₂·6 H₂O, 1.300 g Co(NO₃)₂·6 H₂O, 4.730 g Mn(NO₃)₂·4 H₂O, and 3.008 g LiNO₃, were dissolved in distilled water under constant stirring. The solution was maintained at 75-80 °C in an oil bath to complete dissolution process. Subsequently, 13.52 g of C₆H₈O₇·H₂O was introduced into solution, followed by |
| 10 | 2 | 11 | 12 | 29 | front_matter | column_2_of_2 | p2:body_region:1 | [306.14, 63.88, 240.63, 108.57] | continuous stirring until formation of a homogeneous gel. The gelation process was completed by maintaining the mixture at 80 °C for approximately 4 h. The resulting gel was then dried at 120 °C for 6 h, followed by a two-step calcination process: first at 150 °C for 5 h, and then at 850 °C for 4 h to obtain the final crystalline phase. The obtained nanopowder exhibited a uniform black coloration, indicative of the successful formation of the desired crystalline structure. |
| 11 | 2 | 13 | 14 | 31 | front_matter | column_2_of_2 | p2:body_region:1 | [306.14, 213.88, 240.63, 271.07] | The doped nanopowders were synthesized using a modified sol-gel method analogous to one applied for pure sample [16] with stoichiometric adjustments to incorporate dopants while maintaining charge balance. For both 5% Sn-doped and 5% In-doped variants, the cobalt nitrate hexahydrate (Co(NO₃)₂·6 H₂O) content was reduced to 1.250 g and instead, 0.300 g of either tin nitrate (Sn(NO₃)₂) or indium nitrate (In(NO₃)₃) was added, respectively, while keeping other precursors constant (1.298 g Ni(NO₃)₂·6 H₂O, 4.730 g C₄H₆MnO₄·4 H₂O, and 3.008 g LiNO₃). The precursors were dissolved in 30 g of distilled water under vigorous stirring until complete dissolution and then, the resultant solution was heated to 75-80 °C in an oil bath. Afterward, 13.52 g citric acid monohydrate was gradually added, followed by continuing stirring until formation of a homogeneous vis -cous gel, which was aged at 80 °C for 4 h to complete gelation. The gels were subsequently dried at 120 °C for 6 h, followed by a two-stage calcination process: initial heating at 150 °C for 5 h to remove organic components, and then annealing at 850 °C for 4 h to achieve crystalline phase purity, yielding black, homogeneous nanopowders with well-developed crystal structures. |
| 12 | 2 | 15 | 16 | 33 | body_zone | column_2_of_2 | p2:body_region:1 | [306.14, 538.88, 240.61, 83.57] | For fabrication of working electrodes used in this study, first, the slurry prepared by dispersing active material (85 wt%), polyvinylidene fluoride (PVDF) (5 wt%), and carbon black (10 wt%) in N-methyl-2-pyrrolidone (NMP) solvent was casted on aluminum foil substrate as the current collec -tor. Afterward, the resultant electrode was dried at 120 °C for 12 h. |
| 13 | 2 | 16 | 17 | 34 | body_zone | column_2_of_2 | p2:body_region:1 | [306.14, 626.38, 240.62, 83.57] | The CR2032 coin half-cells employed for all electrochemical analyses were composed of fabricated Li rich cathode as the working electrode and Li foil as the counter electrode. The micro-pores polypropylene membrane (Celgard 2400) was adopted in order to separate the electrodes. For preparation of electrolyte, 1 M LiPF 6 was dissolved in ethylene carbonate (EC)/dimethyl carbonate (DMC) (1:1, |
| 14 | 3 | 1 | 3 | 37 | front_matter | column_1_of_2 | p3:body_region:0 | [51.02, 313.88, 240.61, 21.07] | v/v). The fabrication of coin half-cells was done in dry glove box filled with argon gas. |
| 15 | 3 | 4 | 4 | 38 | front_matter | column_1_of_2 | p3:body_region:0 | [51.02, 338.88, 240.62, 133.57] | Charge and discharge capacity of Li rich cathodes were obtained with a battery tester (Neware multi-channel instrument, CT-3008). The voltage range applied for galvanostatic charge/discharge measurements was 1.8-4.8 V (versus Li/ Li + ). The CV analysis was performed in the potential range of 2.0-5.0 V (versus Li/Li + ). The scan rate applied in CV was 0.5 mV/s. The EIS test was carried out after the first cycle 0.1 C using AC amplitude of 10 mV and frequency range of 100 kHz to 0.1 Hz. The CV and EIS analyses were done at room temperature by means of a Galvanostat/Poten -tiostat Autolab (PG-STAT 302 N). |
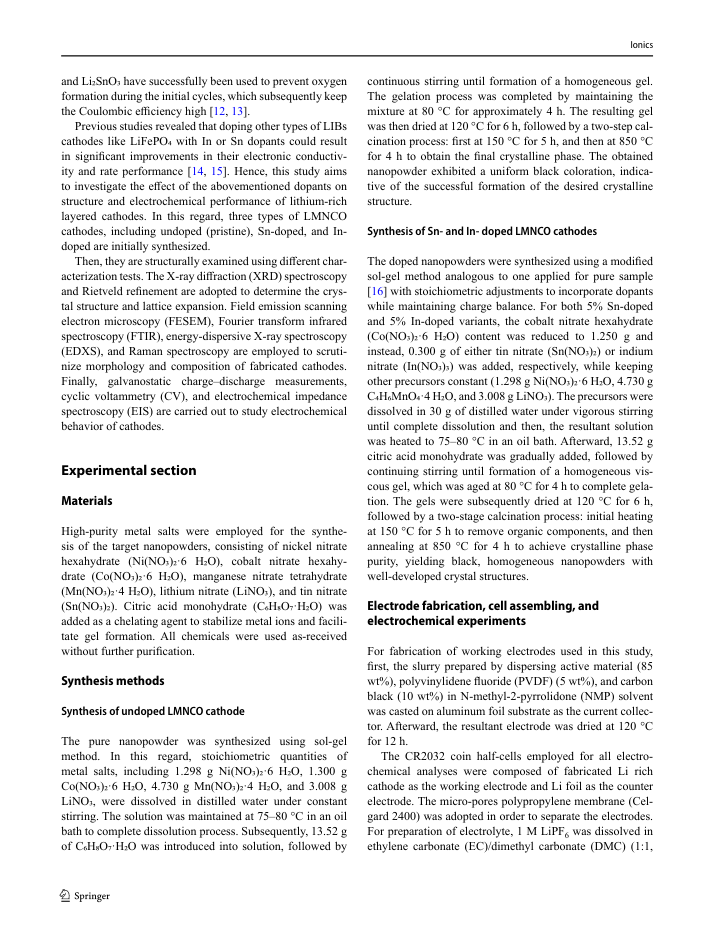
| 16 | 3 | 7 | 7 | 41 | body_zone | column_1_of_2 | p3:body_region:0 | [51.02, 551.38, 240.62, 83.57] | Figure 1 presents XRD patterns of undoped LMNCO cathode material alongside its In- and Sn-doped counterparts. XRD analysis was employed to assess the crystallinity and determine the lattice parameters of the synthesized sam -ples. As illustrated in Fig. 1 a, distinct diffraction peaks are observed at approximately 18.8°, 37.1°, 38.6°, 44.8°, 48.9°, 58.9°, 64.6°, 65.6°, and 68.9°. These peaks are indexed |
| 17 | 3 | 8 | 8 | 42 | front_matter | column_2_of_2 | p3:body_region:1 | [306.14, 63.88, 240.61, 71.11] | according to the JCPDS reference (No. 49-0524), corresponding to the (003), (101), (006), (104), (015), (107), (018), (110), and (113) crystallographic planes, respectively. The results confirm that the undoped LMNCO cathode adopts a well-defined layered α-NaFeO 2 -type structure with an R-3 m space group symmetry [17-21]. |
| 18 | 3 | 9 | 9 | 43 | front_matter | column_2_of_2 | p3:body_region:1 | [306.14, 138.88, 240.64, 308.57] | The XRD pattern of the undoped LMNCO cathode exhibits a characteristic peak at 21.0° (2θ), corresponding to the (020) plane of the trigonal crystal system with negligible monoclinic phase contamination as reported in prior studies [17 ]. The absence of extraneous diffraction peaks confirms the phase purity of the synthesized material. For the In-doped cathode (Fig. 1 b), all fundamental reflections of the layered α-NaFeO₂ structure remain intact, including the (003), (101), (104), (015), (107), (018), (110), and (113) planes. The preservation of the parent structure's diffraction pattern confirms that In doping occurs via isovalent substi -tution without disrupting the long-range crystalline order. In addition to abovementioned peaks, a new diffraction peak emerges at 31° (marked by asterisk). Based on literature, incorporation of dopant(s) into Li₁.₂Mn₀.₅₄Ni₀.₁₃Co₀.₁₃O₂ cathode is sometimes accompanied with formation of impu -rity phase(s), which appear(s) as new diffraction peak(s) in XRD patterns. The reason behind formation of impurity phase(s) could be non-homogeneous blending of reaction raw materials [11]. Figure 1 c presents the XRD pattern of the Sn-doped LMNCO cathode, showing characteristic reflections of the layered α-NaFeO₂ structure between 2θ of 10-75°. A distinct additional peak appears at 27° (marked by asterisk), absent in the undoped material, which is due to formation of impurity phase . |
| 19 | 3 | 10 | 10 | 44 | front_matter | column_2_of_2 | p3:body_region:1 | [306.14, 451.38, 240.63, 183.57] | Rietveld refinement analysis was conducted using X'Pert HighScore Plus software to precisely determine the crystallographic parameters of the synthesized cathode materi -als. Table 1 presents the lattice parameters ( a and c ) along with calculated reliability factors for pure LMNCO cathode and its doped analogues incorporating In or Sn cation. The undoped Li-rich NMC cathode material crystallizes in a hexagonal layered structure with lattice parameters of a = 2.8439 Å and c = 14.2128 Å. Notably, incorporation of either In or Sn dopants induces a systematic expansion of the unit cell, as evidenced by the increased lattice dimen -sions. This structural modification is particularly significant, as previous studies [22, 23] have demonstrated that such lat -tice expansion can enhance lithium-ion diffusion kinetics by reducing electrostatic repulsion during Li⁺ (de)intercalation |
| 20 | 4 | 1 | 1 | 47 | page_body | column_1_of_2 | p4:body_region:0 | [51.02, 63.88, 240.62, 96.07] | processes. All investigated compositions maintain a c/a ratio exceeding 4.99, confirming the preservation of the characteristic layered structure without significant cation mixing. The observed lattice expansion correlates well with the improved electrochemical performance observed in sub -sequent cycling tests, suggesting that the dopant-induced structural modifications effectively mitigate the inherent challenges of Li-rich cathodes. |
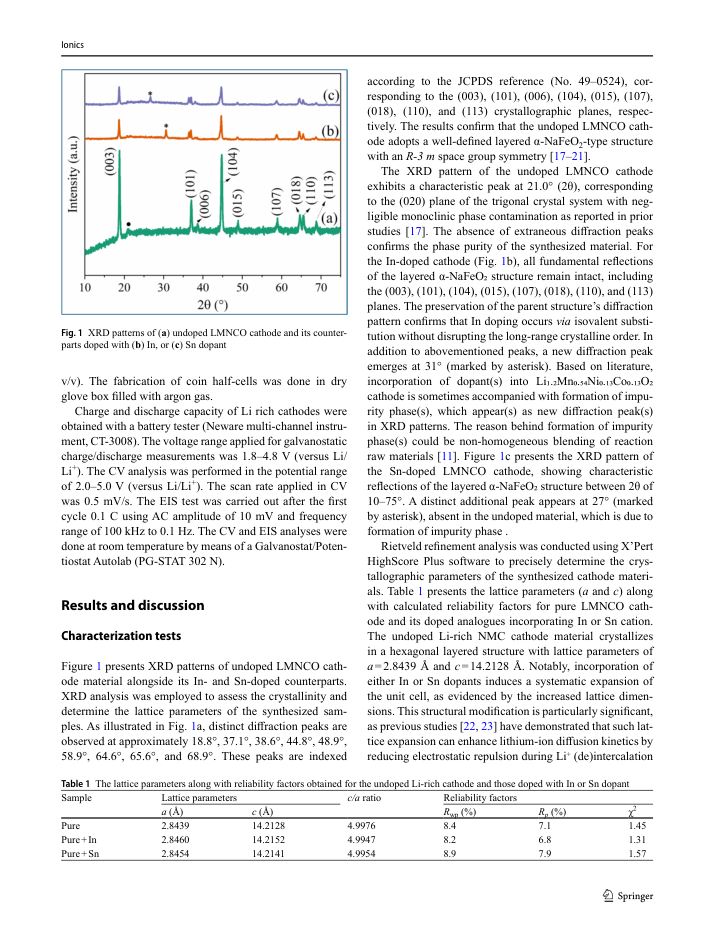
| 21 | 4 | 3 | 2 | 48 | page_body | column_1_of_2 | p4:body_region:0 | [51.02, 163.88, 241.09, 308.57] | Figure 2 presents the FTIR spectra of the undoped Li-rich cathode material alongside those doped with In or Sn. FTIR spectroscopy was employed to characterize the chemical bonding in the synthesized samples. The FTIR spectrum of the undoped LMNCO cathode, recorded within the wavenumber range of 400-4000 cm⁻¹, exhibits distinct absorption bands between 500 and 750 cm⁻¹. As reported in literature [24, 25], metal-oxygen (M-O) bond stretching vibrations typically appear in the 400-800 cm⁻¹ region. Accordingly, the observed vibrational modes within 500-750 cm⁻¹ can be attributed to transition metal (TM)-oxygen (O) stretching vibrations. Notably, the FTIR spectrum of the undoped sample reveals no significant peaks beyond those associated with TM-O bonds, indicating minimal additional functional group contributions. In the FTIR spectrum of the In-doped cathode material (Fig. 2 ), a broad peak is observed near 3500 cm⁻¹, corresponding to the O-H stretching vibration of hydroxyl groups, likely due to adsorbed water molecules [ 26]. Addi -tionally, the characteristic TM-O bond-related peaks remain evident, though their intensity is reduced compared to the undoped sample. This suggests that In doping influences the vibrational modes of the transition metal-oxygen framework. Similar TM-O bond peaks are also present in the spectrum of the Sn-doped cathode, confirming the retention of the primary metal-oxide structure despite doping. |
| 22 | 4 | 5 | 6 | 52 | page_body | column_2_of_2 | p4:body_region:1 | [306.14, 63.88, 240.63, 196.07] | Figure 3 presents FESEM images of the pure LMNCO cathode and its In- and Sn-doped counterparts. As shown in Fig. 3 a, the undoped Li-rich cathode consists of agglomerated polyhedral nanoparticles with an average particle size of approximately 50 nm. The introduction of In dopant (Fig. 3 b) did not induce significant morphological changes, with the polyhedral nanostructure remaining largely unchanged compared to the undoped sample. In contrast, the Sn-doped cathode (Fig. 3 c) retained the characteristic polyhedral morphology of the base material, but with the additional presence of nanosized Sn-containing particles dispersed across the surface. These secondary particles, absent in the undoped and In-doped samples, are attributed to Sn incorporation. Notably, FESEM analysis reveals that doping did not substantially alter the overall microstructure of the Li-rich cathode material. |
| 23 | 4 | 6 | 7 | 53 | page_body | column_2_of_2 | p4:body_region:1 | [306.14, 263.88, 240.63, 233.57] | EDXS analysis was employed to analyze the elemental composition of the synthesized cathode materials. As evi -denced by the EDXS spectrum of the pure LMNCO cathode material (Fig. 3 d), distinct peaks corresponding to the constituent elements - oxygen (O), nickel (Ni), manganese (Mn), and cobalt (Co) - are clearly observed, confirming the expected composition of the undoped Li-rich cathode. Notably, the spectrum shows no detectable signals for In or Sn, indicating the absence of these dopants in the pure cathode material, as anticipated. Figure 3e presents the EDXS spec -trum of the In-doped cathode material. In addition to the characteristic peaks of the host material (O, Ni, Mn, and Co) observed in the undoped sample, distinct indium (In) peaks appear in the 3-4 keV range, confirming successful incorporation of the dopant. Similarly, the EDXS spectrum of the Sn-doped LMNCO cathode (Fig. 3 f) reveals the expected elemental signatures of the base material along with clear tin (Sn) signals in the 3-4 keV region, providing definitive evidence of Sn doping. |
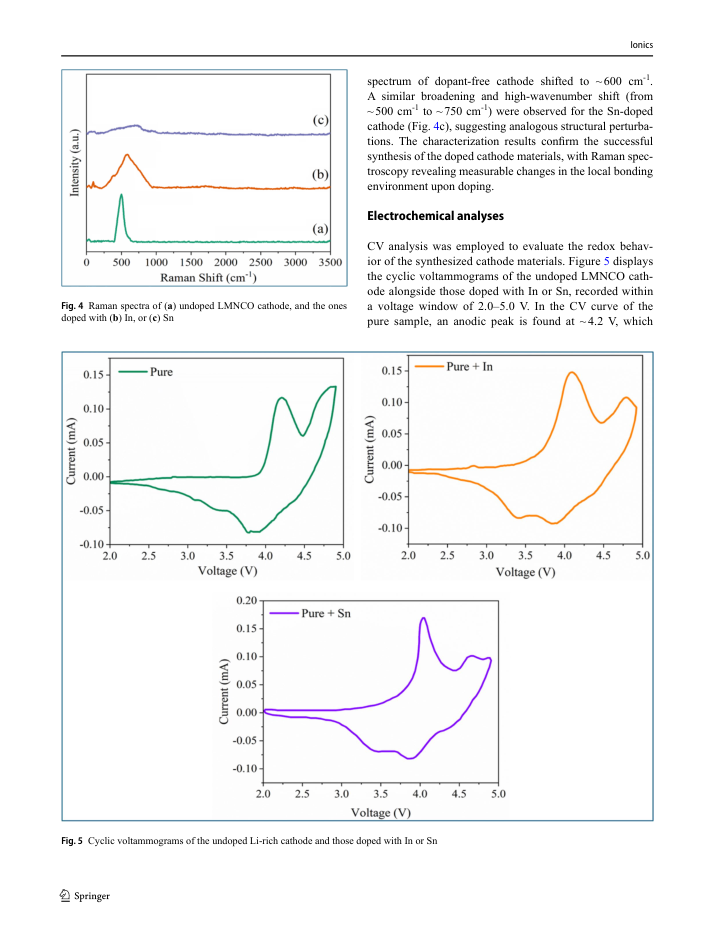
| 24 | 4 | 7 | 8 | 54 | page_body | column_2_of_2 | p4:body_region:1 | [306.14, 501.38, 240.62, 171.07] | Raman spectroscopy was employed to investigate structural modifications induced by doping cathodic materials with In or Sn. Figure 4 a presents the Raman spectrum of the undoped LMNCO cathode material over the wavenumber range of 0-3500 cm⁻¹. A distinct Raman peak is observed at approximately 500 cm⁻¹, corresponding to A₁g mode of R-3 m layered structure associated with the symmetric stretching of transition metal-oxygen (TM-O) bonds in the Li-rich cathode structure [25 , 27 ]. The peak relevant to Eg mode at ~ 470 cm -1 appearing commonly in the Raman spectrum of LMNCO is not clearly observed here. Moreover, the broad fluorescence background seen > 1000 cm⁻¹ in all cathode materials is ascribed to defect-induced luminescence [27, 28]. |
| 25 | 4 | 8 | 9 | 55 | page_body | column_2_of_2 | p4:body_region:1 | [306.14, 676.38, 240.62, 33.57] | Doping with In resulted in peak broadening and a shift toward higher wavenumbers, as evidenced in Fig. 4b. In this regard, the peak of A₁g at ~ 500 cm -1 detected in the Raman |
| 26 | 6 | 1 | 2 | 60 | page_body | right_crossing | p6:body_region:0 | [306.14, 61.87, 240.62, 98.09] | spectrum of dopant-free cathode shifted to ~ 600 cm -1 . A similar broadening and high-wavenumber shift (from ~ 500 cm -1 to ~ 750 cm -1 ) were observed for the Sn-doped cathode (Fig. 4 c), suggesting analogous structural perturbations. The characterization results confirm the successful synthesis of the doped cathode materials, with Raman spectroscopy revealing measurable changes in the local bonding environment upon doping. |
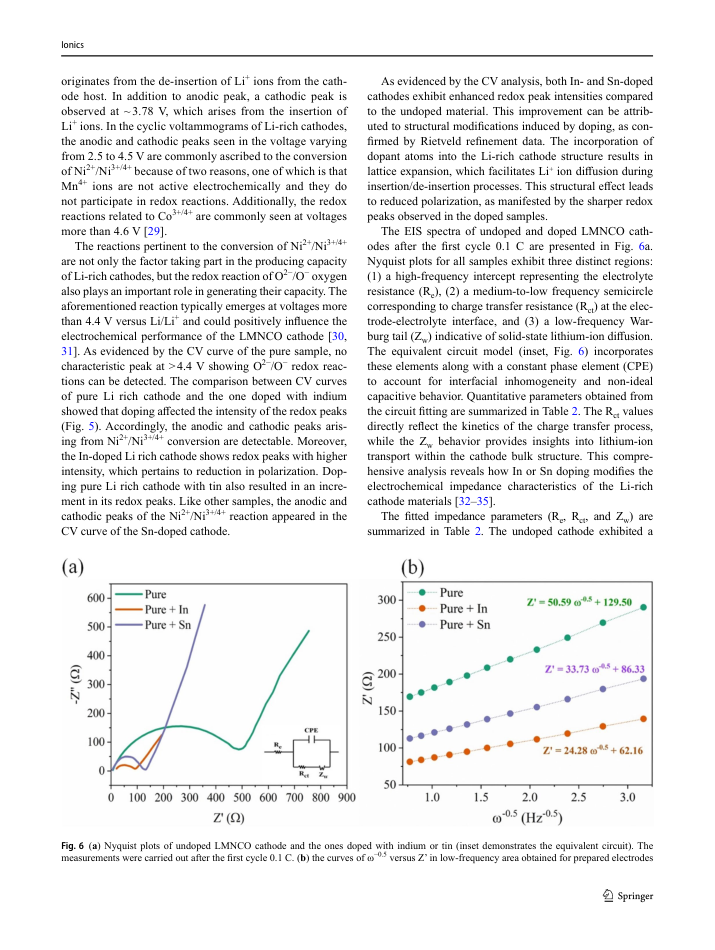
| 27 | 6 | 5 | 5 | 63 | page_body | right_crossing | p6:body_region:0 | [306.14, 201.38, 240.64, 71.07] | CV analysis was employed to evaluate the redox behavior of the synthesized cathode materials. Figure 5 displays the cyclic voltammograms of the undoped LMNCO cathode alongside those doped with In or Sn, recorded within a voltage window of 2.0-5.0 V. In the CV curve of the pure sample, an anodic peak is found at ~ 4.2 V, which |
| 28 | 7 | 1 | 2 | 67 | page_body | column_1_of_2 | p7:body_region:0 | [51.02, 61.87, 240.65, 135.59] | originates from the de-insertion of Li + ions from the cath -ode host. In addition to anodic peak, a cathodic peak is observed at ~ 3.78 V, which arises from the insertion of Li + ions. In the cyclic voltammograms of Li-rich cathodes, the anodic and cathodic peaks seen in the voltage varying from 2.5 to 4.5 V are commonly ascribed to the conversion of Ni 2+ /Ni 3+/4+ because of two reasons, one of which is that Mn 4+ ions are not active electrochemically and they do not participate in redox reactions. Additionally, the redox reactions related to Co 3+/4+ are commonly seen at voltages more than 4.6 V [ 29]. |
| 29 | 7 | 3 | 3 | 68 | page_body | column_1_of_2 | p7:body_region:0 | [51.02, 199.37, 240.62, 248.09] | The reactions pertinent to the conversion of Ni 2+ /Ni 3+/4+ are not only the factor taking part in the producing capacity of Li-rich cathodes, but the redox reaction of O 2/O oxygen also plays an important role in generating their capacity. The aforementioned reaction typically emerges at voltages more than 4.4 V versus Li/Li + and could positively influence the electrochemical performance of the LMNCO cathode [ 30, 31 ]. As evidenced by the CV curve of the pure sample, no characteristic peak at > 4.4 V showing O 2/O redox reactions can be detected. The comparison between CV curves of pure Li rich cathode and the one doped with indium showed that doping affected the intensity of the redox peaks (Fig. 5). Accordingly, the anodic and cathodic peaks arising from Ni 2+ /Ni 3+/4+ conversion are detectable. Moreover, the In-doped Li rich cathode shows redox peaks with higher intensity, which pertains to reduction in polarization. Dop -ing pure Li rich cathode with tin also resulted in an incre -ment in its redox peaks. Like other samples, the anodic and cathodic peaks of the Ni 2+ /Ni 3+/4+ reaction appeared in the CV curve of the Sn-doped cathode. |
| 30 | 7 | 4 | 4 | 69 | page_body | column_2_of_2 | p7:body_region:1 | [306.14, 63.88, 240.62, 121.07] | As evidenced by the CV analysis, both In- and Sn-doped cathodes exhibit enhanced redox peak intensities compared to the undoped material. This improvement can be attrib -uted to structural modifications induced by doping, as confirmed by Rietveld refinement data. The incorporation of dopant atoms into the Li-rich cathode structure results in lattice expansion, which facilitates Li⁺ ion diffusion during insertion/de-insertion processes. This structural effect leads to reduced polarization, as manifested by the sharper redox peaks observed in the doped samples. |
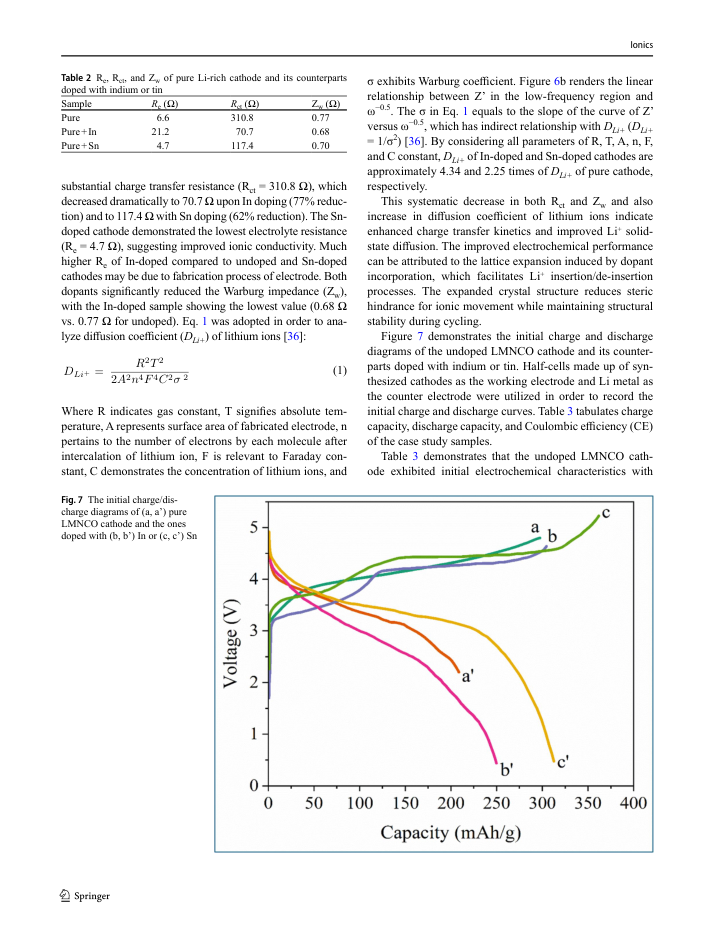
| 31 | 7 | 5 | 5 | 70 | page_body | column_2_of_2 | p7:body_region:1 | [306.14, 188.88, 240.63, 233.57] | The EIS spectra of undoped and doped LMNCO cathodes after the first cycle 0.1 C are presented in Fig. 6a. Nyquist plots for all samples exhibit three distinct regions: (1) a high-frequency intercept representing the electrolyte resistance (R e ), (2) a medium-to-low frequency semicircle corresponding to charge transfer resistance (R ct ) at the electrode-electrolyte interface, and (3) a low-frequency Warburg tail (Z w ) indicative of solid-state lithium-ion diffusion. The equivalent circuit model (inset, Fig. 6 ) incorporates these elements along with a constant phase element (CPE) to account for interfacial inhomogeneity and non-ideal capacitive behavior. Quantitative parameters obtained from the circuit fitting are summarized in Table 2 . The R ct values directly reflect the kinetics of the charge transfer process, while the Z w behavior provides insights into lithium-ion transport within the cathode bulk structure. This comprehensive analysis reveals how In or Sn doping modifies the electrochemical impedance characteristics of the Li-rich cathode materials [3235 ]. |
| 32 | 7 | 6 | 6 | 71 | page_body | column_2_of_2 | p7:body_region:1 | [306.14, 426.38, 241.13, 21.07] | The fitted impedance parameters (R e , R ct , and Z w ) are summarized in Table 2 . The undoped cathode exhibited a |
| 33 | 7 | 7 | 7 | 72 | page_body | column_1_of_2 | [51.07, 701.44, 495.35, 17.48] | Fig. 6 ( a ) Nyquist plots of undoped LMNCO cathode and the ones doped with indium or tin (inset demonstrates the equivalent circuit). The measurements were carried out after the first cycle 0.1 C. ( b ) the curves of ω -0.5 versus Z' in low-frequency area obtained for prepared electrodes | |
| 34 | 8 | 1 | 2 | 75 | page_body | column_1_of_2 | p8:body_region:0 | [51.02, 151.38, 241.53, 135.51] | substantial charge transfer resistance (R ct = 310.8 Ω), which decreased dramatically to 70.7 Ω upon In doping (77% reduction) and to 117.4 Ω with Sn doping (62% reduction). The Sndoped cathode demonstrated the lowest electrolyte resistance (R e = 4.7 Ω), suggesting improved ionic conductivity. Much higher R e of In-doped compared to undoped and Sn-doped cathodes may be due to fabrication process of electrode. Both dopants significantly reduced the Warburg impedance (Z w ), with the In-doped sample showing the lowest value (0.68 Ω vs. 0.77 Ω for undoped). Eq. 1 was adopted in order to ana -lyze diffusion coefficient ( DLi+ ) of lithium ions [ 36]: |
| 35 | 8 | 4 | 3 | 76 | page_body | column_1_of_2 | p8:body_region:0 | [51.02, 338.88, 240.62, 58.57] | Where R indicates gas constant, T signifies absolute temperature, A represents surface area of fabricated electrode, n pertains to the number of electrons by each molecule after intercalation of lithium ion, F is relevant to Faraday con -stant, C demonstrates the concentration of lithium ions, and |
| 36 | 8 | 6 | 7 | 80 | page_body | column_2_of_2 | p8:body_region:1 | [306.14, 63.88, 240.62, 96.07] | σ exhibits Warburg coefficient. Figure 6b renders the linear relationship between Z' in the low-frequency region and ω -0.5 . The σ in Eq. 1 equals to the slope of the curve of Z' versus ω -0.5 , which has indirect relationship with DLi+ ( DLi+ = 1/σ 2 ) [ 36 ]. By considering all parameters of R, T, A, n, F, and C constant, DLi+ of In-doped and Sn-doped cathodes are approximately 4.34 and 2.25 times of DLi+ of pure cathode, respectively. |
| 37 | 8 | 7 | 8 | 81 | page_body | column_2_of_2 | p8:body_region:1 | [306.14, 163.88, 240.62, 108.57] | This systematic decrease in both R ct and Z w and also increase in diffusion coefficient of lithium ions indicate enhanced charge transfer kinetics and improved Li⁺ solidstate diffusion. The improved electrochemical performance can be attributed to the lattice expansion induced by dopant incorporation, which facilitates Li⁺ insertion/de-insertion processes. The expanded crystal structure reduces steric hindrance for ionic movement while maintaining structural stability during cycling. |
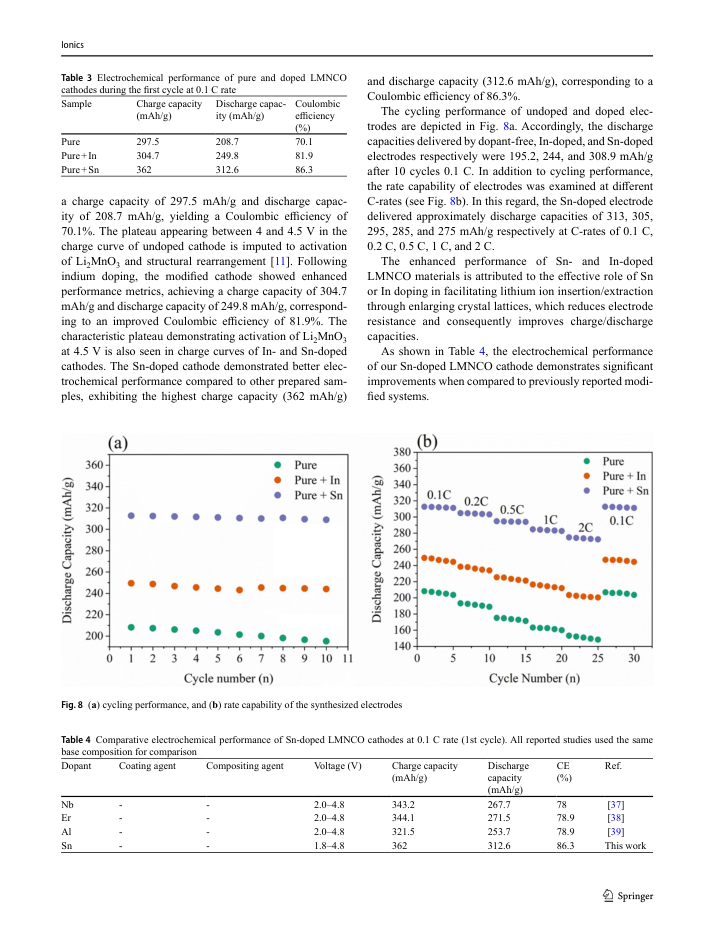
| 38 | 8 | 8 | 9 | 82 | page_body | column_2_of_2 | p8:body_region:1 | [306.14, 276.38, 240.63, 96.07] | Figure 7 demonstrates the initial charge and discharge diagrams of the undoped LMNCO cathode and its counterparts doped with indium or tin. Half-cells made up of synthesized cathodes as the working electrode and Li metal as the counter electrode were utilized in order to record the initial charge and discharge curves. Table 3 tabulates charge capacity, discharge capacity, and Coulombic efficiency (CE) of the case study samples. |
| 39 | 8 | 9 | 10 | 83 | page_body | column_2_of_2 | p8:body_region:1 | [306.14, 376.38, 240.61, 21.07] | Table 3 demonstrates that the undoped LMNCO cathode exhibited initial electrochemical characteristics with |
| 40 | 9 | 1 | 3 | 86 | page_body | column_1_of_2 | p9:body_region:0 | [51.02, 163.88, 240.63, 171.07] | a charge capacity of 297.5 mAh/g and discharge capacity of 208.7 mAh/g, yielding a Coulombic efficiency of 70.1%. The plateau appearing between 4 and 4.5 V in the charge curve of undoped cathode is imputed to activation of Li 2 MnO 3 and structural rearrangement [11]. Following indium doping, the modified cathode showed enhanced performance metrics, achieving a charge capacity of 304.7 mAh/g and discharge capacity of 249.8 mAh/g, correspond -ing to an improved Coulombic efficiency of 81.9%. The characteristic plateau demonstrating activation of Li 2 MnO 3 at 4.5 V is also seen in charge curves of In- and Sn-doped cathodes. The Sn-doped cathode demonstrated better electrochemical performance compared to other prepared sam -ples, exhibiting the highest charge capacity (362 mAh/g) |
| 41 | 9 | 4 | 5 | 88 | page_body | column_2_of_2 | p9:body_region:1 | [306.14, 63.88, 240.61, 21.07] | and discharge capacity (312.6 mAh/g), corresponding to a Coulombic efficiency of 86.3%. |
| 42 | 9 | 5 | 6 | 89 | page_body | column_2_of_2 | p9:body_region:1 | [306.14, 88.88, 240.62, 121.07] | The cycling performance of undoped and doped elec -trodes are depicted in Fig. 8a. Accordingly, the discharge capacities delivered by dopant-free, In-doped, and Sn-doped electrodes respectively were 195.2, 244, and 308.9 mAh/g after 10 cycles 0.1 C. In addition to cycling performance, the rate capability of electrodes was examined at different C-rates (see Fig. 8 b). In this regard, the Sn-doped electrode delivered approximately discharge capacities of 313, 305, 295, 285, and 275 mAh/g respectively at C-rates of 0.1 C, 0.2 C, 0.5 C, 1 C, and 2 C. |
| 43 | 9 | 6 | 7 | 90 | page_body | column_2_of_2 | p9:body_region:1 | [306.14, 213.88, 240.64, 71.07] | The enhanced performance of Snand In-doped LMNCO materials is attributed to the effective role of Sn or In doping in facilitating lithium ion insertion/extraction through enlarging crystal lattices, which reduces electrode resistance and consequently improves charge/discharge capacities. |
| 44 | 9 | 7 | 8 | 91 | page_body | column_2_of_2 | p9:body_region:1 | [306.14, 288.88, 240.61, 46.07] | As shown in Table 4, the electrochemical performance of our Sn-doped LMNCO cathode demonstrates significant improvements when compared to previously reported modi -fied systems. |
| 45 | 10 | 3 | 2 | 95 | body_zone | column_1_of_2 | p10:body_region:0 | [51.02, 88.88, 240.65, 221.07] | In this study, we successfully synthesized Li-rich LMNCO cathode material and systematically investigated the effects of In or Sn doping through comprehensive structural and electrochemical characterization. XRD analysis confirmed the preservation of the layered α-NaFeO₂ structure in all samples while revealing distinct dopant-related peaks at 31° (In-doped) and 27° (Sn-doped), verifying successful incorporation of dopant ions. FTIR spectroscopy detected characteristic TM-O bond vibrations, and Raman spectra showed the A₁g symmetric stretching mode of TM-O bonds, both confirming successful material synthesis. FESEM imaging demonstrated that doping had negligible effects on nanoparticle morphology. Electrochemical characterization revealed significant performance enhancement in doped samples. Both CV and EIS analyses showed reduced charge transfer polarization, attributed to improved Li⁺ ion mobility through dopantinduced lattice expansion. |
| 46 | 10 | 4 | 3 | 96 | body_zone | column_1_of_2 | p10:body_region:0 | [51.02, 313.88, 240.63, 146.07] | Among all fabricated electrodes, the one doped with Sn exhibited the best electrochemical performance. In this regard, it reached discharge capacity of 308.9 mAh/g after 10 cycles. Moreover, Sn-induced electrode delivered discharge capacity of 313, 305, 295, 285, and 275 mAh/g respectively at C-rates of 0.1 C, 0.2 C, 0.5 C, 1 C, and 2 C. These electrochemical propertiescould position the Sn-doped Lirich cathode as a highly promising candidate for advanced energy storage applications. The demonstrated effectiveness of Sn doping in facilitating charge transfer processes sug -gests this approach could be valuable for developing nextgeneration high-performance cathode materials. |