H
original.pdf layout_review.html excluded_blocks.html final_body_blocks.tsv layout_blocks.tsv
绿色编号 = 最终进入正文的段落顺序;蓝色虚线 = section heading 边界。每个条目同时显示 Docling 页内原序、新页内顺序和识别栏位;排序只在同页内调整,不拆分文本块。
| # | page | Docling 页内原序 | 新页内顺序 | global layout order | zone | column | region | bbox | text |
|---|---|---|---|---|---|---|---|---|---|
| 1 | 2 | 8 | 7 | 18 | body_zone | column_1_of_2 | p2:body_region:0 | [51.02, 458.23, 238.16, 171.52] | All of the materials were synthesized by a co-precipitation method. The typical procedures were as follows. First, a certain amount of PEG was dissolved in deionized water, then 4.3076 g manganese acetate tetrahydrate (Mn(CH3COO)2 ⋅ 4H2O,99.0%,Kermel) and 1.9045 g nickel acetate tetrahydrate (Ni(CH3COO)2 ⋅ 4H2O, 98.0 %, Kermel) were added to the PEG solution. An oxalate co-precipitate of Mn and Ni was obtained by the dropwise addition of 4.0809 g oxalic acid dihydrate (C2H2O4 ⋅ 2H2O, 99.5 %, Enox), followed by aging, washing, and filtering, then drying overnight. The precipitate was then calcined at 550 °C for 5 h to obtain a binary oxide. Finally, the binary oxide was mixed with 1.4668 g lithium carbonate (Li2CO3, 97.0 %, Kermel) and then ball-milled for 2 h, followed by calcining at 900 °C in air for 15 h to obtain about 2.5 g Li[Li 0.167 Ni0.25Mn0.580]O2 [18]. |
| 2 | 2 | 9 | 8 | 19 | body_zone | column_1_of_2 | p2:body_region:0 | [51.03, 632.56, 238.21, 21.12] | For comparison, we prepared samples using the same procedures, but without PEG. |
| 3 | 2 | 11 | 10 | 21 | body_zone | column_1_of_2 | p2:body_region:0 | [51.03, 694.81, 238.09, 21.12] | The crystal structure of the materials was characterized on a TD3500 powder diffractometer (Tongda, China) operated at 40 kV |
| 4 | 2 | 12 | 12 | 23 | front_matter | column_2_of_2 | p2:body_region:1 | [306.14, 59.73, 238.08, 71.02] | and 30 mA using CuK α as the radiation source. The particle size and morphology of the samples were examined using a Nova NanoSEM 430 scanning electronic microscope (SEM, Philips, the Netherlands). Thermogravimetric analysis was performed on a Q600 SDT thermal analyzer (TA Inc., USA) in the range of 30 -900 °C at a heating rate of 10 K min -1 in air. |
| 5 | 2 | 14 | 14 | 25 | front_matter | column_2_of_2 | p2:body_region:1 | [306.14, 171.82, 238.19, 270.17] | Charge and discharge performance measurements were carried out with CR-2016 test cells using a lithium metal plate as the anode, Celgard 2400 single polypropylene as the separator, and 1 M lithium hexafluorophosphate (LiPF6) solution (EC/DMC = 1:1 in solvent) as the electrolyte. The cathode was prepared by mixing the cathode material with acetylene black and polyvinylidene fluoride using a weight ratio of 85:5:10 in N -methyl pyrrolidinone; this mixture was then cast on aluminum foil using the doctor blade technique and dried under vacuum at 80 °C overnight. Then, the electrodes with a diameter of 16 mm (or geometrical area of 2.0 cm -2 ) were obtained by cutting the material-coated foil with a mold; the loading of the cathode material on the electrode was obtained by weighing the electrode with balance. The charge and discharge measurements were performed galvanostatically on a Neware Battery Testing System (Shenzhen, China) at the desired current density, between 2 and 4.8 V (vs. Li + /Li) and at room temperature. Electrochemical impedance spectroscopy (EIS) measurements were performed using an IM6e electrochemical workstation (Zahner, Germany). The amplitude of the AC signal was 10 mV over a frequency range of 0.01-10 5 Hz. The lithium metal anode served as both counter and reference electrodes during the EIS measurements. |
| 6 | 2 | 17 | 17 | 28 | body_zone | column_2_of_2 | p2:body_region:1 | [306.14, 517.64, 238.2, 198.29] | Li[Li1/3 -2 x /3Ni x Mn2/3 -x /3]O2 (0 < x < 0.5) are generally recognized to be B composite ^ layered materials of Li2MnO3 and LiNi0.5Mn0.5O2. Because the Mn 4+ in Li2MnO3 is further oxidized only with difficulty, Li2MnO3 generally exhibits poor electrochemical performance. However, it can display perfect electrochemical performance after being combined with an appropriate amount of LiNi0.5Mn0.5O2. Indeed, the ratio of Li2MnO3 to LiNi0.5Mn0.5O2, or the ratio of Mn to Ni, plays an important role in the material ' s electrochemical performance. To optimize the composition, we prepared a series of samples with various ratios of Mn to Ni, as well as various corresponding ratios of Li to Mn: Li[Li0.263Ni0.10Mn0.633]O2, Li[Li0.233Ni0.15Mn0.617]O2, Li[Li0.200Ni0.20Mn0.600]O2, Li[Li0.167Ni0.25Mn0.580]O2, Li[Li0.133Ni0.30Mn0.567]O2, Li[Li0.110Ni0.35Mn0.550]O2, Li[Li0.106Ni0.40Mn0.533]O2, and Li[Li0.103Ni0.45Mn0.516]O2. |
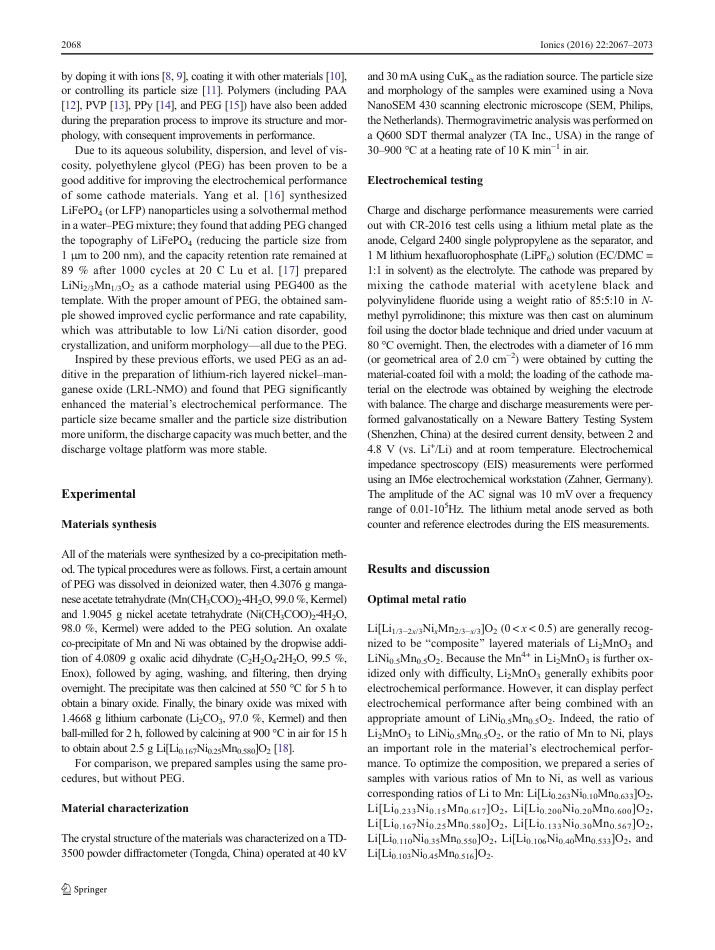
| 7 | 3 | 3 | 2 | 30 | page_body | column_1_of_2 | p3:body_region:0 | [51.02, 59.74, 238.17, 208.83] | The X-ray diffraction (XRD) patterns of the samples are shown in Fig. 1a. All of the samples can be assigned a NaFeO2 layer structure with space group R-3m, apart from some small peaks found in a 2 θ range of 20 -25° that belong to space group C2/m. These small peaks are relevant to the LiMn6 cation ordering that occurs in the transition metal layers of Li2MnO3. With an increase in the amount of Ni, those small peaks gradually disappear; in other words, the samples with Ni content above 0.35 completely belong to space group R-3m [19]. The sharp splits in (018)/(110) signify a layered structure and good structural compatibility between Li2MnO3 and LiNi0.5Mn0.5O2 [20]. However, Fig. 1b shows that the splits in (018)/(110) became increasingly flatter as the amount of Ni rose. The characteristics of the layered structure became less obvious, although this was perhaps simply because the Li2MnO3 was formed in the LiNi0.5Mn0.5O2 layer. |
| 8 | 3 | 4 | 3 | 31 | page_body | column_1_of_2 | p3:body_region:0 | [51.02, 269.62, 238.11, 72.7] | To facilitate further understanding of the compound ' s structure, we list the ratios of I(003)/I(104) in Table 1. Ni 2+ may have traveled from the transition metal layer to the lithium layer, thereby hindering the path of Li + diffusion [17]. Higher ratios of I(003)/I(104), especially above 1.2, have been said to lead to better cationic order. Table 1 shows that all of the ratios |
| 9 | 3 | 5 | 13 | 41 | page_body | column_2_of_2 | p3:body_region:1 | [306.14, 59.73, 238.05, 21.07] | were above 1.2, indicating that the samples had a structure that was beneficial for Li + diffusion. |
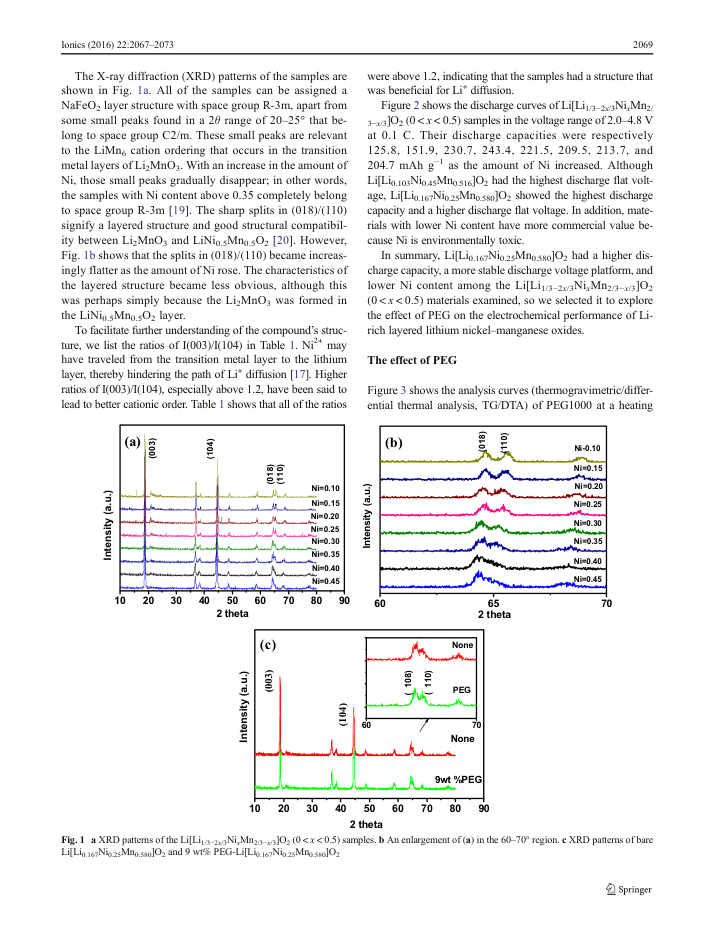
| 10 | 3 | 6 | 14 | 42 | page_body | column_2_of_2 | p3:body_region:1 | [306.14, 84.62, 238.14, 120.73] | Figure 2 shows the discharge curves of Li[Li1/3 -2 x /3Ni x Mn2/ 3 -x /3]O2 (0 < x <0.5) samples in the voltage range of 2.0 -4.8 V at 0.1 C. Their discharge capacities were respectively 125.8, 151.9, 230.7, 243.4, 221.5, 209.5, 213.7, and 204.7 mAh g -1 as the amount of Ni increased. Although Li[Li0.103Ni0.45Mn0.516]O2 had the highest discharge flat voltage, Li[Li0.167Ni0.25Mn0.580]O2 showed the highest discharge capacity and a higher discharge flat voltage. In addition, materials with lower Ni content have more commercial value because Ni is environmentally toxic. |
| 11 | 3 | 7 | 15 | 43 | page_body | column_2_of_2 | p3:body_region:1 | [306.14, 209.18, 238.17, 71.01] | In summary, Li[Li0.167Ni0.25Mn0.580]O2 had a higher discharge capacity, a more stable discharge voltage platform, and lower Ni content among the Li[Li1/3 -2 x /3Ni x Mn2/3 -x /3]O2 (0 < x < 0.5) materials examined, so we selected it to explore the effect of PEG on the electrochemical performance of Lirich layered lithium nickel -manganese oxides. |
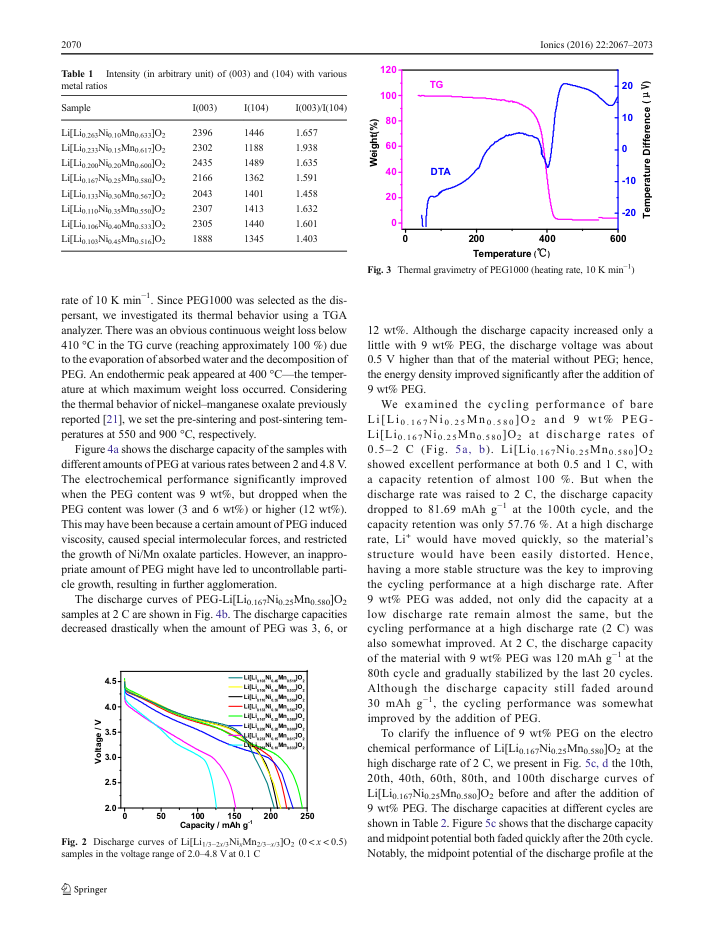
| 12 | 4 | 4 | 3 | 104 | page_body | column_1_of_2 | p4:body_region:0 | [51.0, 241.88, 238.23, 125.33] | rate of 10 K min -1 . Since PEG1000 was selected as the dispersant, we investigated its thermal behavior using a TGA analyzer. There was an obvious continuous weight loss below 410 °C in the TG curve (reaching approximately 100 %) due to the evaporation of absorbed water and the decomposition of PEG. An endothermic peak appeared at 400 °C -the temperature at which maximum weight loss occurred. Considering the thermal behavior of nickel -manganese oxalate previously reported [21], we set the pre-sintering and post-sintering temperatures at 550 and 900 °C, respectively. |
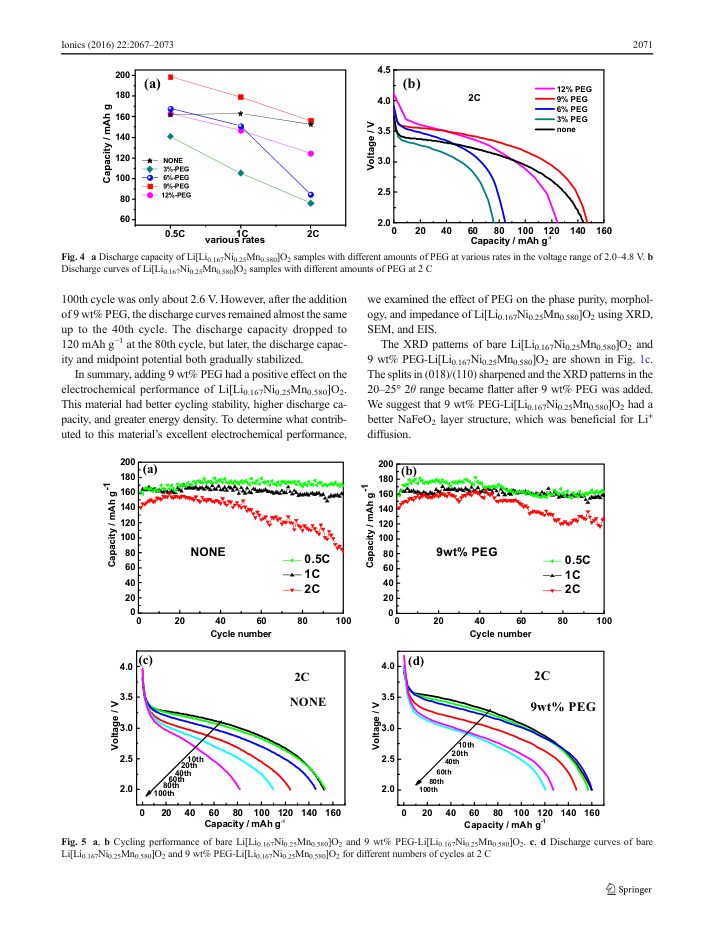
| 13 | 4 | 5 | 4 | 105 | page_body | column_1_of_2 | p4:body_region:0 | [51.0, 370.97, 238.2, 120.73] | Figure 4a shows the discharge capacity of the samples with different amounts of PEG at various rates between 2 and 4.8 V . The electrochemical performance significantly improved when the PEG content was 9 wt%, but dropped when the PEG content was lower (3 and 6 wt%) or higher (12 wt%). This may have been because a certain amount of PEG induced viscosity, caused special intermolecular forces, and restricted the growth of Ni/Mn oxalate particles. However, an inappropriate amount of PEG might have led to uncontrollable particle growth, resulting in further agglomeration. |
| 14 | 4 | 6 | 5 | 106 | page_body | column_1_of_2 | p4:body_region:0 | [51.02, 495.53, 238.19, 33.54] | The discharge curves of PEG-Li[Li0.167Ni0.25Mn0.580]O2 samples at 2 C are shown in Fig. 4b. The discharge capacities decreased drastically when the amount of PEG was 3, 6, or |
| 15 | 4 | 85 | 43 | 144 | page_body | column_2_of_2 | p4:body_region:1 | [306.15, 271.42, 238.21, 58.48] | 12 wt%. Although the discharge capacity increased only a little with 9 wt% PEG, the discharge voltage was about 0.5 V higher than that of the material without PEG; hence, the energy density improved significantly after the addition of 9 wt% PEG. |
| 16 | 4 | 86 | 44 | 145 | page_body | column_2_of_2 | p4:body_region:1 | [306.14, 333.67, 238.15, 270.18] | We examined the cycling performance of bare Li[Li0.167 Ni 0.25 Mn 0.580 ] O 2 and 9 wt% PEGLi[Li0.167Ni0.25Mn0.580]O2 at discharge rates of 0.5 -2 C (Fig. 5a, b). Li[Li0.167Ni0.25Mn0.580]O2 showed excellent performance at both 0.5 and 1 C, with a capacity retention of almost 100 %. But when the discharge rate was raised to 2 C, the discharge capacity dropped to 81.69 mAh g -1 at the 100th cycle, and the capacity retention was only 57.76 %. At a high discharge rate, Li + would have moved quickly, so the material ' s structure would have been easily distorted. Hence, having a more stable structure was the key to improving the cycling performance at a high discharge rate. After 9 wt% PEG was added, not only did the capacity at a low discharge rate remain almost the same, but the cycling performance at a high discharge rate (2 C) was also somewhat improved. At 2 C, the discharge capacity of the material with 9 wt% PEG was 120 mAh g -1 at the 80th cycle and gradually stabilized by the last 20 cycles. Although the discharge capacity still faded around 30 mAh g -1 , the cycling performance was somewhat improved by the addition of PEG. |
| 17 | 4 | 87 | 74 | 175 | page_body | column_2_of_2 | p4:body_region:1 | [306.13, 607.67, 238.18, 108.26] | To clarify the influence of 9 wt% PEG on the electro chemical performance of Li[Li0.167Ni0.25Mn0.580]O2 at the high discharge rate of 2 C, we present in Fig. 5c, d the 10th, 20th, 40th, 60th, 80th, and 100th discharge curves of Li[Li0.167Ni0.25Mn0.580]O2 before and after the addition of 9 wt% PEG. The discharge capacities at different cycles are shown in Table 2. Figure 5c shows that the discharge capacity and midpoint potential both faded quickly after the 20th cycle. Notably, the midpoint potential of the discharge profile at the |
| 18 | 5 | 48 | 48 | 236 | page_body | column_1_of_2 | p5:body_region:0 | [51.02, 246.14, 238.19, 58.48] | 100th cycle was only about 2.6 V. However, after the addition of 9 wt% PEG, the discharge curves remained almost the same up to the 40th cycle. The discharge capacity dropped to 120 mAh g -1 at the 80th cycle, but later, the discharge capacity and midpoint potential both gradually stabilized. |
| 19 | 5 | 49 | 49 | 237 | page_body | column_1_of_2 | p5:body_region:0 | [51.02, 308.39, 238.12, 58.6] | In summary, adding 9 wt% PEG had a positive effect on the electrochemical performance of Li[Li0.167Ni0.25Mn0.580]O2. This material had better cycling stability, higher discharge capacity, and greater energy density. To determine what contributed to this material ' s excellent electrochemical performance, |
| 20 | 5 | 50 | 85 | 273 | page_body | column_2_of_2 | p5:body_region:1 | [306.14, 246.14, 238.11, 33.53] | we examined the effect of PEG on the phase purity, morphology, and impedance of Li[Li0.167Ni0.25Mn0.580]O2 using XRD, SEM, and EIS. |
| 21 | 5 | 51 | 86 | 274 | page_body | column_2_of_2 | p5:body_region:1 | [306.14, 283.5, 238.15, 83.37] | The XRD patterns of bare Li[Li0.167Ni0.25Mn0.580]O2 and 9 wt% PEG-Li[Li0.167Ni0.25Mn0.580]O2 are shown in Fig. 1c. The splits in (018)/(110) sharpened and the XRD patterns in the 20 -25° 2 θ range became flatter after 9 wt% PEG was added. We suggest that 9 wt% PEG-Li[Li0.167Ni0.25Mn0.580]O2 had a better NaFeO2 layer structure, which was beneficial for Li + diffusion. |
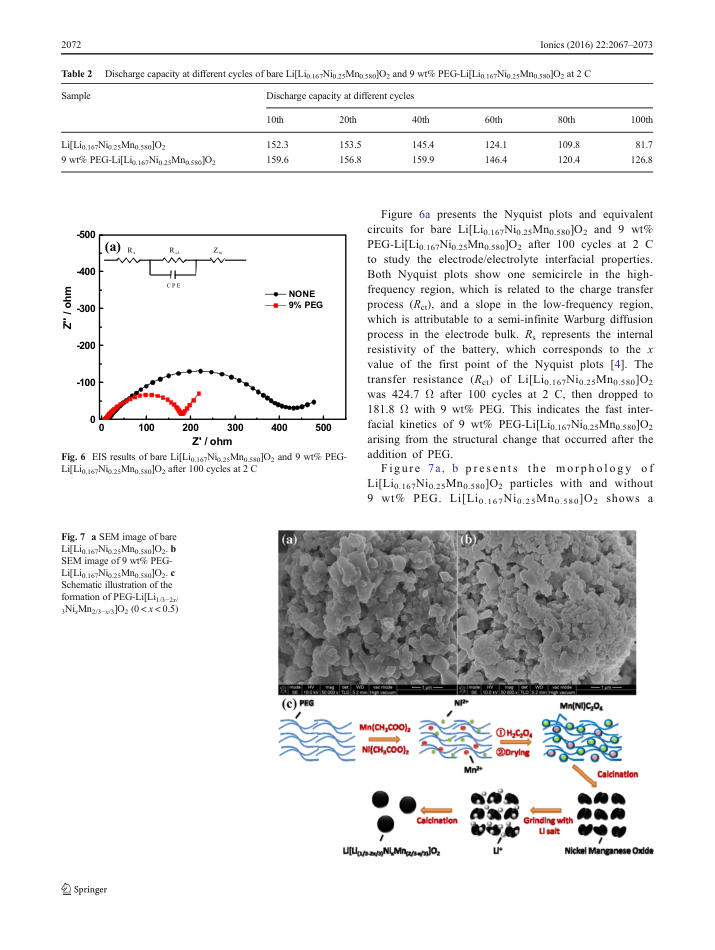
| 22 | 6 | 25 | 25 | 366 | page_body | right_crossing | p6:body_region:0 | [306.13, 175.39, 238.18, 207.92] | Figure 6a presents the Nyquist plots and equivalent circuits for bare Li[Li0.167Ni0.25Mn0.580]O2 and 9 wt% PEG-Li[Li0.167Ni0.25Mn0.580]O2 after 100 cycles at 2 C to study the electrode/electrolyte interfacial properties. Both Nyquist plots show one semicircle in the highfrequency region, which is related to the charge transfer process ( R ct ), and a slope in the low-frequency region, which is attributable to a semi-infinite Warburg diffusion process in the electrode bulk. R s represents the internal resistivity of the battery, which corresponds to the x value of the first point of the Nyquist plots [4]. The transfer resistance ( R ct ) of Li[Li0.167Ni0.25Mn0.580]O2 was 424.7 Ω after 100 cycles at 2 C, then dropped to 181.8 Ω with 9 wt% PEG. This indicates the fast interfacial kinetics of 9 wt% PEG-Li[Li0.167Ni0.25Mn0.580]O2 arising from the structural change that occurred after the addition of PEG. |
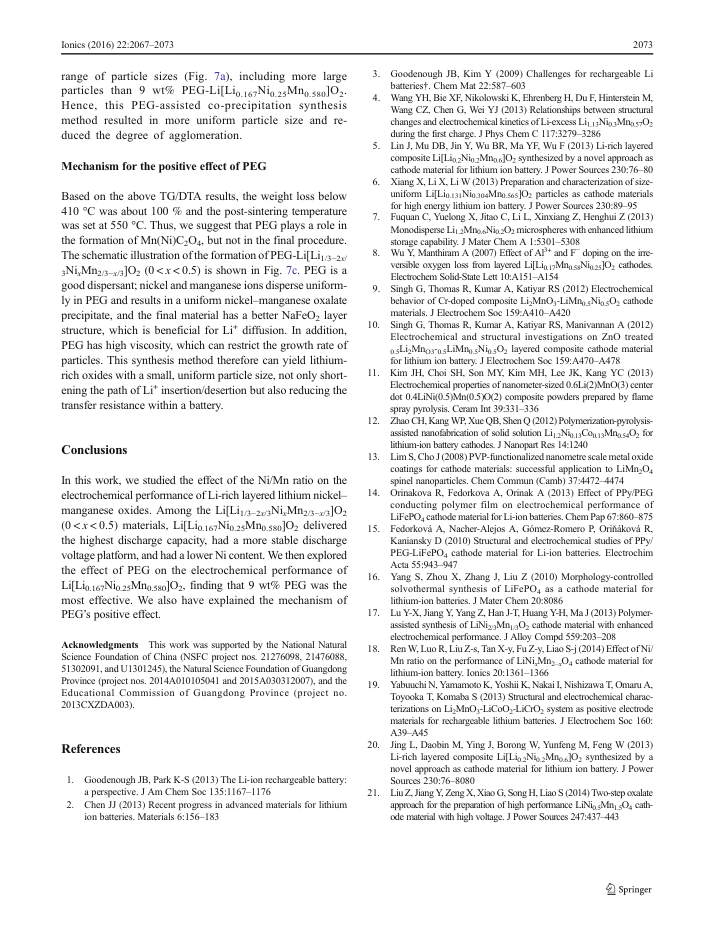
| 23 | 6 | 28 | 27 | 368 | page_body | right_crossing | p6:body_region:0 | [306.14, 387.14, 238.1, 34.49] | Figure 7a, b pr e s e n t s t h e morphology of Li[Li0.167Ni0.25Mn0.580]O2 particles with and without 9 wt% PEG. Li[Li0.167Ni0.25Mn0.580]O2 shows a |
| 24 | 7 | 1 | 2 | 371 | front_matter | column_1_of_2 | p7:body_region:0 | [51.02, 59.74, 238.14, 58.42] | range of particle sizes (Fig. 7a), including more large particles than 9 wt% PEG-Li[Li0.167Ni0.25Mn0.580]O2. Hence, this PEG-assisted co-precipitation synthesis method resulted in more uniform particle size and reduced the degree of agglomeration. |
| 25 | 7 | 5 | 4 | 373 | front_matter | column_1_of_2 | p7:body_region:0 | [51.02, 159.74, 238.21, 182.98] | Based on the above TG/DTA results, the weight loss below 410 °C was about 100 % and the post-sintering temperature was set at 550 °C. Thus, we suggest that PEG plays a role in the formation of Mn(Ni)C2O4, but not in the final procedure. The schematic illustration of the formation of PEG-Li[Li 1/3 -2 x / 3Ni x Mn2/3 -x /3]O2 (0 < x < 0.5) is shown in Fig. 7c. PEG is a good dispersant; nickel and manganese ions disperse uniformly in PEG and results in a uniform nickel -manganese oxalate precipitate, and the final material has a better NaFeO2 layer structure, which is beneficial for Li + diffusion. In addition, PEG has high viscosity, which can restrict the growth rate of particles. This synthesis method therefore can yield lithiumrich oxides with a small, uniform particle size, not only shortening the path of Li + insertion/desertion but also reducing the transfer resistance within a battery. |
| 26 | 7 | 7 | 6 | 375 | body_zone | column_1_of_2 | p7:body_region:0 | [51.02, 396.72, 238.2, 120.85] | In this work, we studied the effect of the Ni/Mn ratio on the electrochemical performance of Li-rich layered lithium nickel -manganese oxides. Among the Li[Li1/3 -2 x /3Ni x Mn2/3 -x /3]O2 (0 < x < 0.5) materials, Li[Li0.167Ni0.25Mn0.580]O2 delivered the highest discharge capacity, had a more stable discharge voltage platform, and had a lower Ni content. We then explored the effect of PEG on the electrochemical performance of Li[Li0.167Ni0.25Mn0.580]O2, finding that 9 wt% PEG was the most effective. We also have explained the mechanism of PEG ' s positive effect. |